

Ternary plot
Encyclopedia
Barycentric coordinates (mathematics)
In geometry, the barycentric coordinate system is a coordinate system in which the location of a point is specified as the center of mass, or barycenter, of masses placed at the vertices of a simplex . Barycentric coordinates are a form of homogeneous coordinates...
plot
Plot (graphics)
A plot is a graphical technique for representing a data set, usually as a graph showing the relationship between two or more variables. The plot can be drawn by hand or by a mechanical or electronic plotter. Graphs are a visual representation of the relationship between variables, very useful for...
on three variables which sum to a constant. It graphically depicts the ratios of the three variables as positions in an equilateral
Equilateral
In geometry, an equilateral polygon is a polygon which has all sides of the same length.For instance, an equilateral triangle is a triangle of equal edge lengths...
triangle
Triangle
A triangle is one of the basic shapes of geometry: a polygon with three corners or vertices and three sides or edges which are line segments. A triangle with vertices A, B, and C is denoted ....
. It is used in physical chemistry
Physical chemistry
Physical chemistry is the study of macroscopic, atomic, subatomic, and particulate phenomena in chemical systems in terms of physical laws and concepts...
, petrology
Petrology
Petrology is the branch of geology that studies rocks, and the conditions in which rocks form....
, mineralogy
Mineralogy
Mineralogy is the study of chemistry, crystal structure, and physical properties of minerals. Specific studies within mineralogy include the processes of mineral origin and formation, classification of minerals, their geographical distribution, as well as their utilization.-History:Early writing...
, metallurgy
Metallurgy
Metallurgy is a domain of materials science that studies the physical and chemical behavior of metallic elements, their intermetallic compounds, and their mixtures, which are called alloys. It is also the technology of metals: the way in which science is applied to their practical use...
, and other physical sciences to show the compositions of systems composed of three species. In population genetics
Population genetics
Population genetics is the study of allele frequency distribution and change under the influence of the four main evolutionary processes: natural selection, genetic drift, mutation and gene flow. It also takes into account the factors of recombination, population subdivision and population...
, it is often called a Gibbs triangle or a de Finetti diagram
De Finetti diagram
A de Finetti diagram is a ternary plot used in population genetics. It is named after the Italian statistician Bruno de Finetti and is used to graph the genotype frequencies of populations, where there are two alleles and the population is diploid...
. In game theory
Game theory
Game theory is a mathematical method for analyzing calculated circumstances, such as in games, where a person’s success is based upon the choices of others...
, it is often called a simplex
Simplex
In geometry, a simplex is a generalization of the notion of a triangle or tetrahedron to arbitrary dimension. Specifically, an n-simplex is an n-dimensional polytope which is the convex hull of its n + 1 vertices. For example, a 2-simplex is a triangle, a 3-simplex is a tetrahedron,...
plot.
In a ternary plot, the proportions of the three variables a, b, and c must sum to some constant, K. Usually, this constant is represented as 1.0 or 100%. Because a + b + c = K for all substances being graphed, any one variable is not independent of the others, so only two variables must be known to find a sample's point on the graph: for instance, c must be equal to K − a − b. Because the three proportions cannot vary independently - there are only two degrees of freedom
Degrees of freedom
Degrees of freedom can mean:* Degrees of freedom , independent displacements and/or rotations that specify the orientation of the body or system...
- it is possible to graph the intersection of all three variables in only two dimensions.
Reading values on the triangular plot
The advantage of using a ternary plot for depicting compositions is that three variables can be conveniently plotted in a two-dimensional graph. Ternary plots can also be used to create phase diagrams by outlining the composition regions on the plot where different phases exist.Every point on a ternary plot represents a different composition of the three components. There are three common methods used to determine the ratios of the three species in the composition. The first method is an estimation based upon the phase diagram grid. The concentration of each species is 100% (pure phase) in its corner of the triangle and 0% at the line opposite it. The percentage of a specific species decreases linearly with increasing distance from this corner, as seen in figures 3-8. By drawing parallel lines at regular intervals between the zero line and the corner (as seen in the images), fine divisions can be established for easy estimation of the content of a species. For a given point, the fraction of each of the three materials in the composition can be determined by the first.
For phase diagrams that do not possess gridlines, the easiest way to determine the composition is to set the altitude of the triangle to 100% and determine the shortest distances from the point of interest to each of the three sides. The distances (the ratios of the distances to the total height of 100%) give the content of each of the species, as shown in figure 1.
The third method is based upon a larger number of measurements, but does not require the drawing of perpendicular lines. Straight lines are drawn from each corner, through the point of interest, to the corresponding side of the triangle. The lengths of these lines, as well as the lengths of the segments between the point and the corresponding sides, are measured individually. Ratios can then be determined by dividing these segments by the entire corresponding line as shown in the figure 2. (The sum of the ratios should add to 1).
Using Cartesian coordinates
Cartesian coordinatesCartesian coordinate system
A Cartesian coordinate system specifies each point uniquely in a plane by a pair of numerical coordinates, which are the signed distances from the point to two fixed perpendicular directed lines, measured in the same unit of length...
are useful for plotting points in the triangle. Consider an equilateral ternary plot where
 is placed at
  and
and  at
at  . Then
  is
is  , and the triple
  is
is
Example
This example shows how this works for a hypothetical set of three soil samples:| Sample # | Organic matter | Clay | Sand | Notes |
| Sample 1 | 80% | 10% | 10% | Because organic matter and clay make up 90% of this sample, the proportion of sand must be 10%. |
| Sample 2 | 50% | 40% | 10% | The proportion of sand is 10% in this sample too, but the proportions of organic matter and clay are different. |
| Sample 3 | 10% | 40% | 50% | This sample has the same proportion of clay as in Sample 2 does, but because it has a smaller proportion of organic matter, the proportion of sand must be larger, because all samples' proportions must sum to 100%. |
See also
- Barycentric coordinates (mathematics)Barycentric coordinates (mathematics)In geometry, the barycentric coordinate system is a coordinate system in which the location of a point is specified as the center of mass, or barycenter, of masses placed at the vertices of a simplex . Barycentric coordinates are a form of homogeneous coordinates...
- Types of ternary plots:
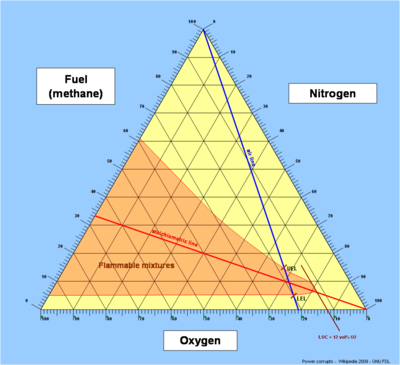
- Flammability diagramFlammability diagramFlammability diagrams show the regimes of flammability in mixtures of fuel, oxygen and an inert gas, typically nitrogen. Mixtures of the three gasses are usually depicted in a triangular diagram, also known as a Ternary plot. Such diagrams are available in the speciality literature...
- QFL diagram
- Flammability diagram
- TrilemmaTrilemmaA trilemma is a difficult choice from three options, each of which is unacceptable or unfavourable.There are two logically equivalent ways in which to express a trilemma: it can be expressed as a choice among three unfavourable options, one of which must be chosen, or as a choice among three...
- Project triangleProject triangleThe Project Triangle in engineering is a triangle model of project. It is a graphic aid where the three attributes show on the corners of the triangle to show opposition. It is useful to help with intentionally choosing project biases, or analyzing the goals of your project...