

Bland-Altman plot
Encyclopedia
Analytical chemistry
Analytical chemistry is the study of the separation, identification, and quantification of the chemical components of natural and artificial materials. Qualitative analysis gives an indication of the identity of the chemical species in the sample and quantitative analysis determines the amount of...
and biostatistics
Biostatistics
Biostatistics is the application of statistics to a wide range of topics in biology...
is a method of data plotting used in analyzing the agreement between two different assay
Assay
An assay is a procedure in molecular biology for testing or measuring the activity of a drug or biochemical in an organism or organic sample. A quantitative assay may also measure the amount of a substance in a sample. Bioassays and immunoassays are among the many varieties of specialized...
s. It is identical to a Tukey
John Tukey
John Wilder Tukey ForMemRS was an American statistician.- Biography :Tukey was born in New Bedford, Massachusetts in 1915, and obtained a B.A. in 1936 and M.Sc. in 1937, in chemistry, from Brown University, before moving to Princeton University where he received a Ph.D...
mean-difference plot, which is what it is still known as in other fields, but was popularised in medical statistics
Medical statistics
Medical statistics deals with applications of statistics to medicine and the health sciences, including epidemiology, public health, forensic medicine, and clinical research...
by J. Martin Bland and Douglas G. Altman
Doug Altman
Professor Douglas G. Altman is a British statistician. He is the Founder and Director of Centre for Statistics in Medicine and Cancer Research UK Medical Statistics Group....
. It is important not to confuse Tukey Mean Difference Test (Bland-Altman test) with Tukey's Test/ Tukey's Method/Tukey's HSD test, which compares the means of every treatment to the means of every other treatment; that is, it applies simultaneously to the set of all pairwise comparisons.
Agreement vs correlation
Bland and Altman make the point that any two methods that are designed to measure the same parameter (or property) will have a good correlationCorrelation
In statistics, dependence refers to any statistical relationship between two random variables or two sets of data. Correlation refers to any of a broad class of statistical relationships involving dependence....
when a set of samples are chosen such that the property to be determined varies a lot between them. A high correlation for any two methods designed to measure the same property is thus in itself just a sign that one has chosen a wide spread sample. A high correlation does not automatically imply that there is good agreement between the two methods.
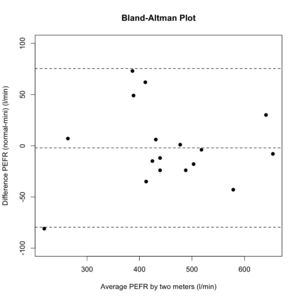
How to construct a Bland-Altman plot
Consider a set of n samples (for example, objects of unknown volume). Both assays (for example, different methods of volume measurement) are performed on each sample, resulting in 2n data points. Each of the n samples is then represented on the graph by assigning the meanMean
In statistics, mean has two related meanings:* the arithmetic mean .* the expected value of a random variable, which is also called the population mean....
of the two measurements as the abscissa (x-axis) value, and the difference between the two values as the ordinate (y-axis) value.
Hence, the Cartesian coordinates
Cartesian coordinate system
A Cartesian coordinate system specifies each point uniquely in a plane by a pair of numerical coordinates, which are the signed distances from the point to two fixed perpendicular directed lines, measured in the same unit of length...
of a given sample S with values of
 and
and  determined by the two assays is
Application
One primary application of the Bland-Altman plot is to compare two clinical measurements that each provide some errors in their measure. It can also be used to compare a new measurement technique or method with a gold standardGold standard (test)
In medicine and statistics, gold standard test refers to a diagnostic test or benchmark that is the best available under reasonable conditions. It does not have to be necessarily the best possible test for the condition in absolute terms...
even so the interest of the Bland-Altman plot is contested in this particular case because the error pertains to the sole new measure. See Analyse-it
Analyse-it
Analyse-it is a statistical analysis add-in for Microsoft Excel. Analyse-it is the successor to Astute, developed in 1992 for Excel 4 and the first statistical analysis add-in for Microsoft Excel...
or MedCalc
MedCalc
MedCalc is a statistical software package designed for the biomedical sciences. It has an integrated spreadsheet for data input and can import files in several formats...
for software providing Bland-Altman plots.
It is common to compute the limits of agreement during Bland-Altman analysis. This is usually specified as bias ± 1.96 STD (average difference ± 1.96 standard deviation of the difference).
External links
- Bland-Altman plot explanation with R statistical programming language.
- Bland-Altman plots using Analyse-it and Excel
- Bland-Altman plots using MedCalc
- Bland-Altman Analysis using SAS
- Bland-Altman analysis, with Lin's concordance coefficient, in Stata
- Martin Bland's home page - Design and analysis of measurement studies