
.gif)
Support (technical analysis)
Encyclopedia
Support and resistance is a concept in technical analysis
that the movement of the price of a security
will tend to stop and reverse at certain predetermined price levels.
Reactive support and resistance are the opposite: they are formed directly as a result of price action or volume behaviour. They include Volume Profile, Price Swing lows/highs, Initial Balance, Open Gaps, certain Candle Patterns (e.g. Engulfing, Tweezers) and OHLC.
Various methods of determining support and resistance exist.
Once you have the chart of entity under consideration, there are many ways to ascertain these levels. Some of the most prevalent methods are;
A price histogram is useful in showing at what price a market has spent more relative time. Psychological levels near round numbers often serve as support and resistance. More recently, volatility has been used to calculate potential support and resistance.
Both proactive and reactive support and resistance methods have merit and form a staple part of any support and resistance based trading strategy.
. Some traders believe in using pivot point calculations.
The more often a support/resistance level is "tested" (touched and bounced off by price), the more significance given to that specific level.
If a price breaks past a support level, that support level often becomes a new resistance level. The opposite is true as well, if price breaks a resistance level, it will often find support at that level in the future.

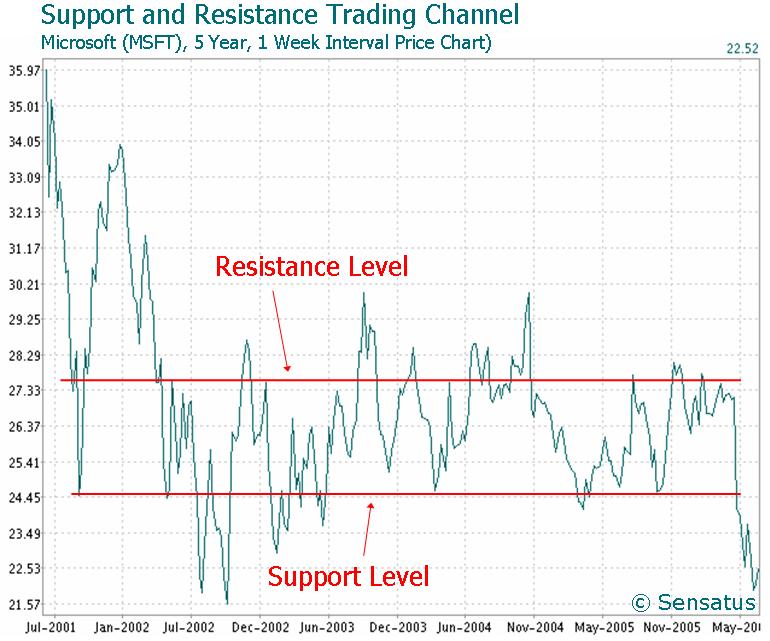
If a stock price is moving between support and resistance levels, then a basic investment strategy commonly used by traders, is to buy a stock at support and sell at resistance, then short at resistance and cover the short at support as per the following example:
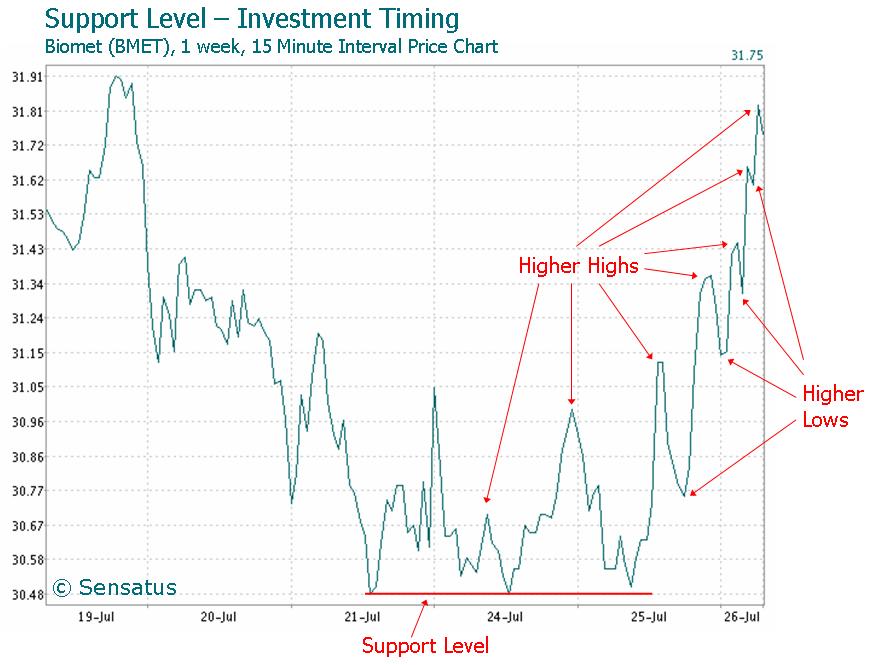
When judging entry and exit investment timing using support or resistance levels it is important to choose a chart based on a price interval period that aligns with your trading strategy timeframe. Short term traders tend to use charts based on interval periods, such as 1 minute (i.e. the price of the security is plotted on the chart every 1 minute), with longer term traders using price charts based on hourly, daily, weekly or monthly interval periods. Typically traders use shorter term interval charts when making a final decisions on when to invest, such as the following example based on 1 week of historical data with price plotted every 15 minutes. In this example the early signs that the stock was coming out of a downtrend was when it started to form support at $30.48 and then started to form higher highs and higher lows signalling a change from negative to positive trending.
Support and resistance levels can used similarly for a wide variety of securities, from positions in equities like the example above to positions in commodity futures, foreign currency, options, and virtually any other derivative.
Technical analysis
In finance, technical analysis is security analysis discipline for forecasting the direction of prices through the study of past market data, primarily price and volume. Behavioral economics and quantitative analysis incorporate technical analysis, which being an aspect of active management stands...
that the movement of the price of a security
Security (finance)
A security is generally a fungible, negotiable financial instrument representing financial value. Securities are broadly categorized into:* debt securities ,* equity securities, e.g., common stocks; and,...
will tend to stop and reverse at certain predetermined price levels.
Support
A support level is a price level where the price tends to find support as it is going down. This means the price is more likely to "bounce" off this level rather than break through it. However, once the price has passed this level, by an amount exceeding some noise, it is likely to continue dropping until it finds another support level.Resistance
A resistance level is the opposite of a support level. It is where the price tends to find resistance as it is going up. This means the price is more likely to "bounce" off this level rather than break through it. However, once the price has passed this level, by an amount exceeding some noise, it is likely that it will continue rising until it finds another resistance level.Reactive vs Proactive support and resistance
Proactive support and resistance methods are 'predictive' in that they often outline areas where price has not actually been. They are based upon current price action that through analysis has been shown to be predictive of future price action. Proactive support and resistance methods include Measured Moves, Swing Ratio Projection/Confluence (Static (Square of Nine), Dynamic (Fibonacci)), Calculated Pivots, Volatility Based, Trendlines and Moving averages, VWAP, Market Profile (VAH, VAL and POC).Reactive support and resistance are the opposite: they are formed directly as a result of price action or volume behaviour. They include Volume Profile, Price Swing lows/highs, Initial Balance, Open Gaps, certain Candle Patterns (e.g. Engulfing, Tweezers) and OHLC.
Various methods of determining support and resistance exist.
Once you have the chart of entity under consideration, there are many ways to ascertain these levels. Some of the most prevalent methods are;
- Horizontal Price Levels
- Trend Lines
- Moving Averages
- Fibonacci Retracement Levels
- and sometimes Round Numbers too
A price histogram is useful in showing at what price a market has spent more relative time. Psychological levels near round numbers often serve as support and resistance. More recently, volatility has been used to calculate potential support and resistance.
Both proactive and reactive support and resistance methods have merit and form a staple part of any support and resistance based trading strategy.
Identifying support and resistance levels
Support and resistance levels can be identified by trend linesTrend lines (technical analysis)
A trend line is formed when you can draw a diagonal line between two or more price pivot points. They are commonly used to judge entry and exit investment timing when trading securities. It can also be referred to a dutch line as it was first used in Holland.A trend line is a bounding line for the...
. Some traders believe in using pivot point calculations.
The more often a support/resistance level is "tested" (touched and bounced off by price), the more significance given to that specific level.
If a price breaks past a support level, that support level often becomes a new resistance level. The opposite is true as well, if price breaks a resistance level, it will often find support at that level in the future.
Using support and resistance levels
This is an example of support switching roles with resistance, and vice versa:If a stock price is moving between support and resistance levels, then a basic investment strategy commonly used by traders, is to buy a stock at support and sell at resistance, then short at resistance and cover the short at support as per the following example:
When judging entry and exit investment timing using support or resistance levels it is important to choose a chart based on a price interval period that aligns with your trading strategy timeframe. Short term traders tend to use charts based on interval periods, such as 1 minute (i.e. the price of the security is plotted on the chart every 1 minute), with longer term traders using price charts based on hourly, daily, weekly or monthly interval periods. Typically traders use shorter term interval charts when making a final decisions on when to invest, such as the following example based on 1 week of historical data with price plotted every 15 minutes. In this example the early signs that the stock was coming out of a downtrend was when it started to form support at $30.48 and then started to form higher highs and higher lows signalling a change from negative to positive trending.
Support and resistance levels can used similarly for a wide variety of securities, from positions in equities like the example above to positions in commodity futures, foreign currency, options, and virtually any other derivative.
See also
- Top (technical analysis)Top (technical analysis)In technical analysis, a top is an event in which a security's market price reaches a high, then a higher high, and then a lower high.The first high signifies the pressure from buying was greater than the pressure from selling. The second higher high suggests that buying still had more pressure...
- Trend lines (technical analysis)Trend lines (technical analysis)A trend line is formed when you can draw a diagonal line between two or more price pivot points. They are commonly used to judge entry and exit investment timing when trading securities. It can also be referred to a dutch line as it was first used in Holland.A trend line is a bounding line for the...
- Stock market bottom
- Price discoveryPrice discoveryThe price discovery process is the process of determining the price of an asset in the marketplace through the interactions of buyers and sellers ....
- Representativeness heuristicRepresentativeness heuristicThe representativeness heuristic is a psychological term describing a phenomenon wherein people judge the probability or frequency of a hypothesis by considering how much the hypothesis resembles available data as opposed to using a Bayesian calculation. While often very useful in everyday life, it...
- Fibonacci retracementFibonacci retracementIn finance, Fibonacci retracements is a method of technical analysis for determining support and resistance levels. They are named after their use of the Fibonacci sequence...