
Proximity mapping
Encyclopedia
In marketing
and business strategy, proximity mapping is a technique used by IBM
, McKinsey and other corporations to illustrate the relative closeness of market segments or characteristics in a two-dimensional space -- typically a sheet of paper or a presentation slide.
 The map was constructed in response to the often-repeated statement that Dell, Inc. expands into adjacent markets. Historically, such statements have tended not to be supported by an explanation of what an adjacent market might be, leaving many with the tautologous feeling that an adjacent market is simply one that Dell expands into.
This map was constructed on the basis that, given any pair of IT markets, the more vendors that are common to both markets, the closer they should be on the map.
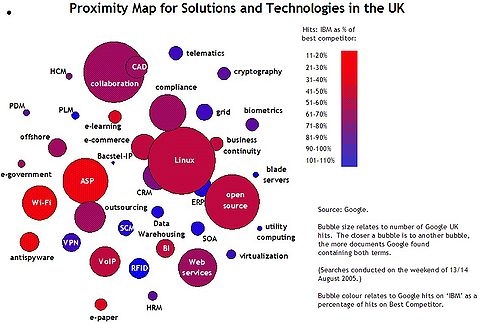 This proximity map was designed to show the strength of the association between various IT technologies and solutions, in terms of UK-focussed documents on the Internet. A lengthy series of searches on Google was conducted:
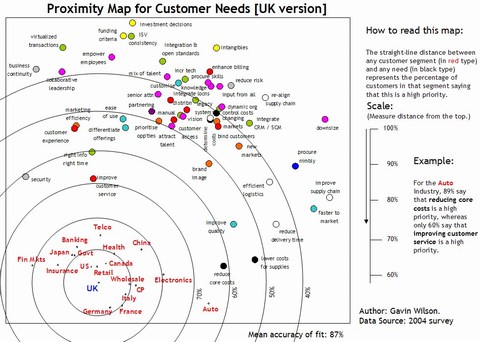 This map was intended to show the strength of various technology-related needs and various customer groupings—split by country and my industry.
Examples of the types of entities that can be proximity-mapped include:
An example of an entity that cannot be proximity-mapped is:
Marketing
Marketing is the process used to determine what products or services may be of interest to customers, and the strategy to use in sales, communications and business development. It generates the strategy that underlies sales techniques, business communication, and business developments...
and business strategy, proximity mapping is a technique used by IBM
IBM
International Business Machines Corporation or IBM is an American multinational technology and consulting corporation headquartered in Armonk, New York, United States. IBM manufactures and sells computer hardware and software, and it offers infrastructure, hosting and consulting services in areas...
, McKinsey and other corporations to illustrate the relative closeness of market segments or characteristics in a two-dimensional space -- typically a sheet of paper or a presentation slide.
Adjacent Markets
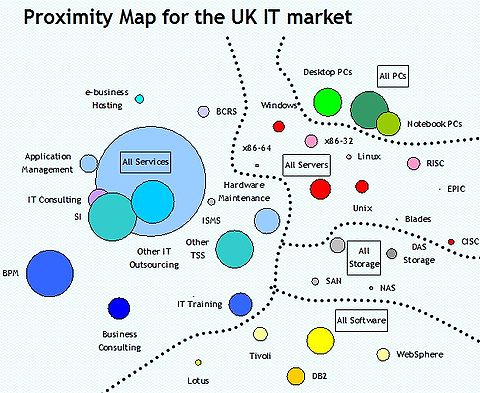
Here, for example, is a proximity map of the IT market in the UK, based on 2004 values:This map was constructed on the basis that, given any pair of IT markets, the more vendors that are common to both markets, the closer they should be on the map.
- The relative size of each circle is proportional to the size of that UK market in 2004, as measured by IDC.
- The relative distance between the centres of any pair of circles is negatively correlated with the number of vendors which operate successfully in both markets.
- This entails comparing the Top 10 vendors in each of the two markets, counting the number of vendors common to both, and creating a distance metric equal to 10 minus that vendor count.
- The use of a tool such as Excel Solver can then be used to find the optimum placing of these points which minimises the difference between the required distance as measured by the metric and the compromise distance needed to locate all the points in two-dimensional space.
- The colouration of each circle is simply to aid the eye in locating all middleware markets, server markets etc.
Related IT Solutions and Technologies
- The size of each circle represents the total number of documents that Google found containing 'UK' and the solution name.
- The distance between each pair of circles is negatively correlated with the number of documents found by Google containing 'UK' and solution1-name and solution2-name.
- The basis for colouring the circles is independent of the proximity mapping, but in this case it is based on the number of documents found by Google that associate IBM with the solution relative to the number of documents associating the best competitor with the solution.
Customer Groups and their Needs
- The name of each customer group appears in red type.
- Each need appears in black type.
- The closer a need is found on the map to a customer group, the stronger that need is felt by that group.
Choosing a distance metric
To avoid a potentially absurd result, the formula d(A, B) chosen to represent the distance between any two sets A and B must satisfy the four basic requirements of a metric space:- d(A, B) >= 0
- d(A, B) = 0 if and only if A = B
- d(A, B) = d(B, A)
- d(A, B) + d(B, C) >= d(A, C)
Examples of the types of entities that can be proximity-mapped include:
- Markets, by the number of vendors common to each pair,
- Keywords, by the number of documents containing each pair of keywords,
- Segments and needs, by the percentage of members of each segment rating the need a high priority.
An example of an entity that cannot be proximity-mapped is:
- People, by the closeness of their relationships. (This fails one of the requirements of a metric because A can be very close to both B and C, yet B and C might be very distant from each other.)
See also
- Multidimensional scalingMultidimensional scalingMultidimensional scaling is a set of related statistical techniques often used in information visualization for exploring similarities or dissimilarities in data. MDS is a special case of ordination. An MDS algorithm starts with a matrix of item–item similarities, then assigns a location to each...
- Morphological analysisMorphological analysisMorphological Analysis or General Morphological Analysis is a method developed by Fritz Zwicky for exploring all the possible solutions to a multi-dimensional, non-quantified problem complex.-Overview:...
- Relational proximityRelationismRelationism can refer to:*In social thought, Karl Mannheim pioneered the idea of Relationism, in the development of his theories on the Sociology of Knowledge...