
Eye chart
Encyclopedia
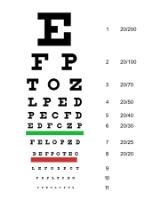
An eye chart is a chart used to measure visual acuity
. Types of eye charts include the logMAR chart
, Snellen chart
, Landolt C
, and the Lea test
.
s (test symbols), each row in a different size. The person is asked to identify the numbers or letters on the chart, usually starting with large rows and continuing to smaller rows until the optotypes cannot be reliably identified anymore.
Technically speaking, testing visual acuity with an eye chart is a psychophysical
measurement that attempts to determine a sensory threshold
(see also psychometric function
).
chart is similar: rows have circles with different segments missing, and the test-taker describes where each broken piece is located. The last two kinds of charts also reduce the possibility of the patient guessing the images.
While visual acuity charts are usually designed for use at 6 metres or 20 feet, there is often also a need to test a subject's vision at near or occupational tasks (like reading or computer use). For these situations near-point charts have been created.
Visual acuity
Visual acuity is acuteness or clearness of vision, which is dependent on the sharpness of the retinal focus within the eye and the sensitivity of the interpretative faculty of the brain....
. Types of eye charts include the logMAR chart
LogMAR chart
LogMAR charts are used to assess an individual's visual acuity . LogMAR means the logarithm of the Minimum Angle of Resolution. It is recommended that whenever research on visual acuity has to be done, the LogMAR chart is to be used...
, Snellen chart
Snellen chart
A Snellen chart is an eye chart used by eye care professionals and others to measure visual acuity. Snellen charts are named after the Dutch ophthalmologist Herman Snellen who developed the chart during 1862...
, Landolt C
Landolt C
A Landolt C, also known as a Japanese Vision Test, Landolt ring or Landolt broken ring, is an optotype, i.e. a standardized symbol used for testing vision. It was developed by the Swiss-born ophthalmologist Edmund Landolt....
, and the Lea test
Lea test
A Lea test is a visual acuity test tailored for children who do not know the alphabet normally used in eye charts. The optotypes are outlines of an apple, a house, a square, and a circle. This test was developed by Finnish ophthalmologist Lea Hyvärinen in 1976 and has been calibrated against...
.
Procedure
Charts usually display several rows of optotypeOptotype
An optotype is a standardized symbol for testing vision. Optotypes can be specially shaped letters, numbers, or geometric symbols. For instance, to determine visual acuity, optotypes of different sizes are presented to a person and the smallest size is determined at which the person can reliably...
s (test symbols), each row in a different size. The person is asked to identify the numbers or letters on the chart, usually starting with large rows and continuing to smaller rows until the optotypes cannot be reliably identified anymore.
Technically speaking, testing visual acuity with an eye chart is a psychophysical
Psychophysics
Psychophysics quantitatively investigates the relationship between physical stimuli and the sensations and perceptions they effect. Psychophysics has been described as "the scientific study of the relation between stimulus and sensation" or, more completely, as "the analysis of perceptual...
measurement that attempts to determine a sensory threshold
Sensory threshold
Sensory threshold is a theoretical concept used in psychophysics. A stimulus that is less intense than the sensory threshold will not elicit any sensation...
(see also psychometric function
Psychometric function
A psychometric function describes the relationship between a parameter of a physical stimulus and the responses of a person who has to decide about a certain aspect of that stimulus. Usually these sensory decisions take the form of a two-alternative forced choice . The psychometric function usually...
).
Variations
Charts are available for very young children or illiterate adults that do not require letter recognition. One version uses simple pictures or patterns. Others are printed with the block letter "E" turned in different orientations, the so called Tumbling E. The patient simply indicates which direction each "E" is facing. The Landolt CLandolt C
A Landolt C, also known as a Japanese Vision Test, Landolt ring or Landolt broken ring, is an optotype, i.e. a standardized symbol used for testing vision. It was developed by the Swiss-born ophthalmologist Edmund Landolt....
chart is similar: rows have circles with different segments missing, and the test-taker describes where each broken piece is located. The last two kinds of charts also reduce the possibility of the patient guessing the images.
Alternatives
Computer-based semi-automatic alternatives to the eye chart have been developed, but are not very common. They have several potential advantages, such as a more precise measurement and less examiner-induced bias. Some of them are also well suited for children since they resemble a video game.While visual acuity charts are usually designed for use at 6 metres or 20 feet, there is often also a need to test a subject's vision at near or occupational tasks (like reading or computer use). For these situations near-point charts have been created.