

Demographic history of Romania
Encyclopedia
This article presents the demographic history of Romania
through census
results. See Demographics of Romania
for a more detailed overview of the country's present-day demographics.
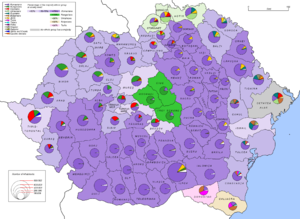
The 1930 census was the only one to cover Greater Romania
. Censuses in 1948, 1956, 1966, 1977, 1992 and 2002 covered Romania's present-day territory. All but the 1948 census, which asked about mother tongue, had a question on ethnicity. Moldavia
and Wallachia
each held a census in 1859. The Romanian Old Kingdom
conducted statistical estimates in 1884, 1889 and 1894, and held censuses in 1899 and 1912. Ion Antonescu
's regime also held two: a general one in April 1941, and one for those with "Jewish blood" in May 1942.
* Mainly in Dobruja
(details)
Romania
Romania is a country located at the crossroads of Central and Southeastern Europe, on the Lower Danube, within and outside the Carpathian arch, bordering on the Black Sea...
through census
Census
A census is the procedure of systematically acquiring and recording information about the members of a given population. It is a regularly occurring and official count of a particular population. The term is used mostly in connection with national population and housing censuses; other common...
results. See Demographics of Romania
Demographics of Romania
This article is about the demographic features of the population of Romania, including population density, ethnicity, education level, health of the populace, economic status, religious affiliations and other aspects of the population....
for a more detailed overview of the country's present-day demographics.
The 1930 census was the only one to cover Greater Romania
Greater Romania
The Greater Romania generally refers to the territory of Romania in the years between the First World War and the Second World War, the largest geographical extent of Romania up to that time and its largest peacetime extent ever ; more precisely, it refers to the territory of the Kingdom of...
. Censuses in 1948, 1956, 1966, 1977, 1992 and 2002 covered Romania's present-day territory. All but the 1948 census, which asked about mother tongue, had a question on ethnicity. Moldavia
Moldavia
Moldavia is a geographic and historical region and former principality in Eastern Europe, corresponding to the territory between the Eastern Carpathians and the Dniester river...
and Wallachia
Wallachia
Wallachia or Walachia is a historical and geographical region of Romania. It is situated north of the Danube and south of the Southern Carpathians...
each held a census in 1859. The Romanian Old Kingdom
Romanian Old Kingdom
The Romanian Old Kingdom is a colloquial term referring to the territory covered by the first independent Romanian nation state, which was composed of the Danubian Principalities—Wallachia and Moldavia...
conducted statistical estimates in 1884, 1889 and 1894, and held censuses in 1899 and 1912. Ion Antonescu
Ion Antonescu
Ion Victor Antonescu was a Romanian soldier, authoritarian politician and convicted war criminal. The Prime Minister and Conducător during most of World War II, he presided over two successive wartime dictatorships...
's regime also held two: a general one in April 1941, and one for those with "Jewish blood" in May 1942.
1866 estimate
| Religion | number | % |
|---|---|---|
| Romanian Orthodox | 4,198,862 | 94.9 |
| Jewish | 134,168 | 3.0 |
| Roman Catholic | 45,152 | 1.0 |
| Protestant | 28,903 | 0.7 |
| Armenian Apostolic | 8,375 | 0.2 |
| Armenian Catholic | 8,178 | 0.2 |
| Muslim | 1,323 | 0.0 |
| Total | 4,424,961 | 100.0 |
1887 estimate
| Ethnicity | number | % |
|---|---|---|
| Romanians | 4,500,000 | 81.8 |
| Jews | 300,000 | 5.5 |
| Roma | 200,000 | 3.6 |
| Bulgarians | 100,000 | 1.8 |
| Germans | 50,000 | 0.9 |
| Hungarians | 50,000 | 0.9 |
| Armenians | 15,000 | 0.3 |
| Others* | 285,000 | 5.2 |
| Total | 5,500,000 | 100.0 |
Dobruja
Dobruja is a historical region shared by Bulgaria and Romania, located between the lower Danube river and the Black Sea, including the Danube Delta, Romanian coast and the northernmost part of the Bulgarian coast...
(details)
December 1899 census
| Ethnicity | number | % |
|---|---|---|
| Romanians | 5,489,296 | 92.2 |
| Jews | 256,588 | 4.3 |
| Others | 210,806 | 3.5 |
| Total | 5,956,690 | 100.0 |
19 December 1912 census
| number | % | |
|---|---|---|
| Total | 7,234,919 | 100.0 |
29 December 1930 census
| Ethnicity | number | % |
|---|---|---|
| Romanians | 12,981,324 | 71.9 |
| Hungarians | 1,425,507 | 7.9 |
| Germans | 745,421 | 4.1 |
| Jews | 728,115 | 4.0 |
| Ruthenians and Ukrainians | 582,115 | 3.2 |
| Russians | 409,150 | 2.3 |
| Bulgarians | 366,384 | 2.0 |
| Roma | 262,501 | 1.5 |
| Turks | 154,772 | 0.9 |
| Gagauz | 105,750 | 0.6 |
| Czechs and Slovaks | 51,842 | 0.3 |
| Serbs, Croats and Slovenes | 51,062 | 0.3 |
| Poles | 48,310 | 0.3 |
| Greeks | 26,495 | 0.1 |
| Tatars | 22,141 | 0.1 |
| Armenians | 15,544 | 0.0 |
| Hutsuls | 12,456 | 0.0 |
| Albanians | 4,670 | 0.0 |
| Others | 56,355 | 0.3 |
| Undeclared | 7,114 | 0.0 |
| Total | 18,057,028 | 100.0 |
6 April 1941 census
| number | % | |
|---|---|---|
| Total | 13,535,757 | 100.0 |
25 January 1948 census
| Mother tongue | number | % |
|---|---|---|
| Romanian | 13,597,613 | 85.7 |
| Hungarian | 1,499,851 | 9.4 |
| German | 343,913 | 2.2 |
| Yiddish | 138,795 | 0.9 |
| Romani | 53,425 | 0.3 |
| Serbian, Croatian and Slovenian | 45,447 | 0.3 |
| Russian | 39,332 | 0.2 |
| Ukrainian | 37,582 | 0.2 |
| Czech and Slovak | 35,143 | 0.2 |
| Turkish and Tatar | 28,782 | 0.2 |
| Bulgarian | 13,408 | 0.1 |
| Greek | 8,696 | 0.1 |
| Armenian | 6,987 | 0.0 |
| Polish | 6,753 | 0.0 |
| Albanian | 735 | 0.0 |
| Others | 15,639 | 0.2 |
| Undeclared | 523 | 0.0 |
| Total | 15,872,624 | 100.0 |
21 February 1956 census
| Ethnicity | number | % |
|---|---|---|
| Romanians | 14,996,114 | 85.7 |
| Hungarians | 1,587,675 | 9.1 |
| Germans | 384,708 | 2.2 |
| Jews | 146,264 | 0.8 |
| Roma | 104,216 | 0.6 |
| Ukrainians | 60,479 | 0.4 |
| Serbs, Croats and Slovenes | 46,517 | 0.3 |
| Russians | 38,731 | 0.2 |
| Slovaks | 23,331 | 0.2 |
| Tatars | 20,469 | 0.2 |
| Turks | 14,329 | 0.1 |
| Bulgarians | 12,040 | 0.1 |
| Czechs | 11,821 | 0.0 |
| Greeks | 11,166 | 0.0 |
| Poles | 7,627 | 0.0 |
| Armenians | 6,441 | 0.0 |
| Others | 13,357 | 0.1 |
| Undeclared | 4,165 | 0.0 |
| Total | 17,489,450 | 100.0 |
15 March 1966 census
| Ethnicity | number | % |
|---|---|---|
| Romanians | 16,746,510 | 87.7 |
| Hungarians | 1,619,592 | 8.5 |
| Germans | 382,595 | 2.0 |
| Roma | 64,197 | 0.3 |
| Ukrainians | 54,705 | 0.3 |
| Serbs, Croats and Slovenes | 44,236 | 0.3 |
| Jews | 42,888 | 0.2 |
| Russians | 39,483 | 0.2 |
| Slovaks | 22,221 | 0.1 |
| Tatars | 22,151 | 0.1 |
| Turks | 18,040 | 0.1 |
| Bulgarians | 11,193 | 0.1 |
| Czechs | 9,978 | 0.0 |
| Greeks | 9,088 | 0.0 |
| Poles | 5,860 | 0.0 |
| Armenians | 3,436 | 0.0 |
| Others | 4,681 | 0.0 |
| Undeclared | 2,309 | 0.0 |
| Total | 19,103,163 | 100.0 |
5 January 1977 census
| Ethnicity | number | % |
|---|---|---|
| Romanians | 18,999,565 | 88.1 |
| Hungarians | 1,713,928 | 7.9 |
| Germans | 359,109 | 1.6 |
| Roma | 227,398 | 1.05 |
| Ukrainians | 55,510 | 0.3 |
| Serbs | 34,429 | 0.2 |
| Russians | 32,696 | 0.2 |
| Jews | 24,667 | 0.1 |
| Turks | 23,422 | 0.1 |
| Tatars | 23,369 | 0.1 |
| Slovaks | 21,286 | 0.1 |
| Bulgarians | 10,372 | 0.0 |
| Czechs | 7,683 | 0.0 |
| Croats | 7,500 | 0.0 |
| Greeks | 6,262 | 0.0 |
| Poles | 4,641 | 0.0 |
| Armenians | 2,342 | 0.0 |
| Others | 5,279 | 0.0 |
| Undeclared | 452 | 0.0 |
| Total | 21,559,910 | 100.0 |
7 January 1992 census
| Ethnicity | number | % |
|---|---|---|
| Romanians | 20,408,542 | 89.5 |
| Hungarians | 1,624,959 | 7.1 |
| Roma | 401,087 | 1.8 |
| Germans | 119,462 | 0.5 |
| Ukrainians | 65,472 | 0.3 |
| Russians | 38,606 | 0.2 |
| Turks | 29,832 | 0.1 |
| Serbs | 29,408 | 0.1 |
| Tatars | 24,596 | 0.1 |
| Slovaks | 19,594 | 0.1 |
| Bulgarians | 9,851 | 0.1 |
| Jews | 8,955 | 0.0 |
| Czechs | 5,797 | 0.0 |
| Poles | 4,232 | 0.0 |
| Croats | 4,085 | 0.0 |
| Greeks | 3,940 | 0.0 |
| Armenians | 1,957 | 0.0 |
| Others | 8,894 | 0.0 |
| Undeclared | 766 | 0.0 |
| Total | 22,810,035 | 100.0 |
18 March 2002 census
| Ethnicity | number | % |
|---|---|---|
| Romanians | 19,399,597 | 89.5 |
| Hungarians | 1,431,807 | 6.6 |
| Roma | 535,140 | 2.5 |
| Ukrainians | 61,098 | 0.3 |
| Germans | 59,764 | 0.3 |
| Lipovan Russians | 35,791 | 0.2 |
| Turks | 32,098 | 0.2 |
| Tatars | 23,935 | 0.1 |
| Serbs | 22,561 | 0.1 |
| Slovaks | 17,226 | 0.1 |
| Bulgarians | 8,025 | 0.0 |
| Croats | 6,807 | 0.0 |
| Greeks | 6,472 | 0.0 |
| Jews | 5,785 | 0.0 |
| Czechs | 3,941 | 0.0 |
| Poles | 3,559 | 0.0 |
| Italians | 3,288 | 0.0 |
| Chinese | 2,243 | 0.0 |
| Armenians | 1,780 | 0.0 |
| Csángó | 1,266 | 0.0 |
| Macedonians Macedonians (ethnic group) The Macedonians also referred to as Macedonian Slavs: "... the term Slavomacedonian was introduced and was accepted by the community itself, which at the time had a much more widespread non-Greek Macedonian ethnic consciousness... |
695 | 0.0 |
| Albanians | 477 | 0.0 |
| Ruthenians | 257 | 0.0 |
| Krashovani | 206 | 0.0 |
| Slovenes | 202 | 0.0 |
| Others | 15,013 | 0.1 |
| Undeclared | 1,941 | 0.0 |
| Total | 21,680,974 | 100.0 |