
Berwick Area School District
Encyclopedia
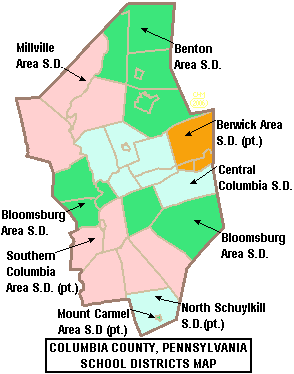
Columbia County, Pennsylvania
As of the census of 2000, there were 64,151 people, 24,915 households, and 16,568 families residing in the county. The population density was 132 people per square mile . There were 27,733 housing units at an average density of 57 per square mile...
it covers the Boroughs of Berwick
Berwick, Pennsylvania
Berwick is a borough in Columbia County, Pennsylvania, 22.6 miles southwest of Wilkes Barre. Berwick is one of two principal cities of the Bloomsburg–Berwick Micropolitan Statistical Area, a micropolitan area that covers Columbia and Montour counties and had a combined population of 82,387...
and Briar Creek
Briar Creek, Pennsylvania
Briar Creek is a borough in Columbia County, Pennsylvania, United States. The population was 651 at the 2000 census. It is part of the Bloomsburg–Berwick Micropolitan Statistical Area.-Geography:Briar Creek is located at ....
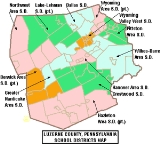
and Briar Creek Township. In Luzerne County
Luzerne County, Pennsylvania
- Demographics :As of the 2010 census, the county was 90.7% White, 3.4% Black or African American, 0.2% Native American, 1.0% Asian, 3.3% were of some other race, and 1.5% were two or more races. 6.7% of the population was of Hispanic or Latino ancestry...
it covers the Borough of Nescopeck
Nescopeck, Pennsylvania
Nescopeck is a borough in Luzerne County, Pennsylvania, United States. The population was 1,528 at the 2000 census.-Geography:Nescopeck is located at ....
and Hollenback Township, Nescopeck Township and Salem Township
Salem Township, Luzerne County, Pennsylvania
Salem Township is a township in Luzerne County, Pennsylvania, United States. The population was 4,269 at the 2000 census.-Geography:According to the United States Census Bureau, the township has a total area of 30.0 square miles , of which, 29.0 square miles of it is land and...
. According to 2000 federal census data, it serves a resident population of 22,622. The per capita income
Per capita income
Per capita income or income per person is a measure of mean income within an economic aggregate, such as a country or city. It is calculated by taking a measure of all sources of income in the aggregate and dividing it by the total population...
of residents was $16,041 in 2009, while the median family income was $37,684 a year. According to District officials, in school year 2007-08 the Berwick Area School District provided basic educational services to 3,176 pupils. It employed: 257 teachers, 300 full-time and part-time support personnel, and 16 administrators.
The district operates: Berwick Area Senior High School
Berwick Area Senior High School
Berwick Area Senior High School is a public high school in Berwick, a borough located in Columbia County, in Northeastern Pennsylvania, USA...
, Berwick Middle School, Salem Elementary School, Orange Street Elementary School, 14th Street Elementary School and Nescopeck Elementary School.
Governance
The school district is governed by 9 individually elected board members (serve four year terms), the Pennsylvania State Board of Education, the Pennsylvania Department of EducationPennsylvania Department of Education
The Pennsylvania Department of Education is the executive department of the state charged with K-12 and adult educational budgeting, management and guidelines. As the state education agency, its activities are directed by Pennsylvania's Secretary of Education, Gerald L. Zahorchak...
and the Pennsylvania General Assembly
Pennsylvania General Assembly
The Pennsylvania General Assembly is the state legislature of the U.S. state of Pennsylvania. The legislature convenes in the State Capitol building in Harrisburg. In colonial times , the legislature was known as the Pennsylvania Provincial Assembly. Since the Constitution of 1776, written by...
. The federal government controls programs it funds like Title I funding for low income children in the Elementary and Secondary Education Act
Elementary and Secondary Education Act
The Elementary and Secondary Education Act , is a United States federal statute enacted April 11, 1965. It was passed as a part of President Lyndon B. Johnson's "War on Poverty" and has been the most far-reaching federal legislation affecting education ever passed by Congress...
and the No Child Left Behind Act
No Child Left Behind Act
The No Child Left Behind Act of 2001 is a United States Act of Congress concerning the education of children in public schools.NCLB was originally proposed by the administration of George W. Bush immediately after he took office...
which mandates the district focus resources on student success in acquiring reading and math skills.
The Commonwealth Foundation for Public Policy Alternatives Sunshine Review gave the school board and district administration a "D-" for transparency based on a review of "What information can people find on their school district's website". It examined the school district's website for information regarding; taxes, the current budget, meetings, school board members names and terms, contracts, audits, public records information and more.
Academic achievement
Berwick Area School District was ranked 394th out of the 498 ranked Pennsylvania school districts in 2011 by the Pittsburgh Business Times. The ranking was based on student academic achievement as demonstrated by 5 years of PSSAPennsylvania System of School Assessment
The Pennsylvania System of School Assessment is a standardized test administered to public schools in the state of Pennsylvania. Students in grades 3, 4, 5, 6, 7, 8, and 11 are assessed in reading skills and mathematics. Students in grades 5, 8, and 11 are assessed in writing skills...
results in: reading, writing, math, and three years of science.
- 2010 - 378th
- 2009 - 349th
- 2008 - 328th
- 2007 - 311th out of 501 Pennsylvania school districts.
In 2010, the Pittsburgh Business Times reported an Overachievers Ranking for 498 Pennsylvania school districts. Berwick Area ranked 249th. In 2009 the district was 256th. The paper describes the ranking as: "a ranking answers the question - which school districts do better than expectations based upon economics? This rank takes the Honor Roll rank and adds the percentage of students in the district eligible for free and reduced lunch into the formula. A district finishing high on this rank is smashing expectations, and any district above the median point is exceeding expectations."
In 2009, the academic achievement, of the students in the Berwick Area School District, was in the 31st percentile among all 500 Pennsylvania school districts. Scale (0-99; 100 is state best)
Graduation rate
In 2011, the graduation rate was 87%. In 2010, the Pennsylvania Department of Education issued a new, 4 year cohort graduation rate. Berwick Area High School's rate was 80% for 2010.Former Graduation rate calculation:
- 2010 - 88%
- 2009 - 88%
- 2008 - 85%
- 2007 - 85%
- 2006 - 81%
- 2005 - 82%
High school
In 2011, the school declined to School Improvement II status due to ongoing low student achievement. Under the federal No Child Left Behind Law, the school notified parents they could transfer their child to an achieving school within the district. The district operates on high school, meaning no transfer was possible. The administration was required to develop and submit tot the Pennsylvania Department of Education a school improvement plan. In 2010 and 2009, the high school was in School Improvement I status due to lagging student achievement and a low graduation rate.PSSA Results
11th Grade Reading:
- 2011 - 65% on grade level (17.9% below basic). In Pennsylvania, 69% of 11th graders on grade level.
- 2010 - 60%, State - 67%
- 2009 - 65%, State - 65%
- 2008 - 62%, State - 65%
- 2007 - 67%, State - 65%
- 2006 - 69%, State - 65%
- 2005 - 70%, State - 65%
11th Grade Math:
- 2011 - 54% on grade level, (22% below basic). In Pennsylvania, 60.3% of 11th graders are on grade level.
- 2010 - 52%, State - 59% of 11th graders are on grade level.
- 2009 - 54%, State - 56%
- 2008 - 48%, State - 56%
- 2007 - 44%, State - 53%
- 2006 - 54%, State - 52%
- 2005 - 50%, State - 51%
11th Grade Science:
- 2011 - 34.9% on grade level. State - 40% of 11th graders were on grade level.
- 2010 - 39%, State - 39%
- 2009 - 33%, State - 40%
- 2008 - 39%, State - 39%
College Remediation: According to a Pennsylvania Department of Education
Pennsylvania Department of Education
The Pennsylvania Department of Education is the executive department of the state charged with K-12 and adult educational budgeting, management and guidelines. As the state education agency, its activities are directed by Pennsylvania's Secretary of Education, Gerald L. Zahorchak...
study released in January 2009, 25% of Berwick Area School District graduates required remediation in mathematics and or reading before they were prepared to take college level courses in the Pennsylvania State System of Higher Education
Pennsylvania State System of Higher Education
The Pennsylvania State System of Higher Education is the largest provider of higher education in the Commonwealth of Pennsylvania and a large public university system in the United States. It is the tenth-largest university system in the United States and 43rd largest in the world...
or community colleges. Less than 66% of Pennsylvania high school graduates, who enroll in a four-year college in Pennsylvania, will earn a bachelor's degree within six years. Among Pennsylvania high school graduates pursuing an associate degree, only one in three graduate in three years. Per the Pennsylvania Department of Education
Pennsylvania Department of Education
The Pennsylvania Department of Education is the executive department of the state charged with K-12 and adult educational budgeting, management and guidelines. As the state education agency, its activities are directed by Pennsylvania's Secretary of Education, Gerald L. Zahorchak...
, one in three recent high school graduates who attend Pennsylvania's public universities and community colleges takes at least one remedial course in math, reading or English.
Dual enrollment
The high school offers a Dual EnrollmentDual enrollment
In education, dual enrollment involved students being enrolled in two separate, academically related institutions. It may also refer to any individual who is participating in two related programs, but such a general form of usage is uncommon....
program. This state program permits high school students to take courses, at local higher education institutions, to earn college credits. Students remain enrolled at their high school. The courses count towards high school graduation requirements and towards earning a college degree. The students continue to have full access to activities at their high school. The college credits are offered at a deeply discounted rate. The state offers a small grant to assist students in costs for tuition, fees and books. Under the Pennsylvania Transfer and Articulation Agreement, many Pennsylvania colleges and universities accept these credits for students who transfer to their institutions. The Pennsylvania College Credit Transfer System reported in 2009, that students saved nearly $35.4 million by having their transferred credits count towards a degree under the new system.
For the 2009-10 funding year, the school district received a state grant of $6,779 for the program.
Non district students, who reside in the district and attend a private nonpublic school, charter school or are homeschooled are eligible to participate in this program.
Graduation requirements
Graduation requirements include achieving a minimum of 25 credits and designing a graduation project which is based on the 21st Century Skills and the National Technology Standards. By law, all Pennsylvania secondary school students must complete a project as a part of their eligibility to graduate from high school. The type of project, its rigor and its expectations are set by the individual school district. The class of 2012 will be required to complete a graduation project which includes the creation of an electronic portfolio.Beginning with the class of 2015, students must take the Keystone Exams in reading and math.
Middle school
In 2011, the school improved to achieving AYP status. In 2010, the school was in Making Progress: in Corrective Action I level. In 2009, the school was in Corrective Action I level due to chronic, low academic achievement. According to the federal No Child Left Behind Law, students may transfer to another middle school where available.8th Grade Reading:
- 2011 - 68.6% on grade level (19.5% below basic). In Pennsylvania, 81.8% of 8th graders on grade level. Ranked last in Reading in the CSIU 16 region middle schools.
- 2010 - 69%, State - 81%
Ranked 19th out of 19 eighth grades in the CSIU16 region.
- 2009 - 74%, State - 80.9% of 8th graders were on grade level.
- 2008 - 73%, State - 78%
- 2007 - 72%, State - 75%
- 2006 - 64%, State - 70%
8th Grade Math:
- 2011 - 70.8% on grade level (16% below basic). In Pennsylvania, 76.9% of 8th graders are on grade level. Ranked 18th out of 19 eighth grades in the CSIU16 region.
- 2010 - 69%, State - 75%. Ranked 19th out of 19 eighth grades in the CSIU16 region.
- 2009 - 66% State - 71% Ranked 18th out of 19 eighth grades in the CSIU16 region.
- 2008 - 69%, State - 70%
- 2007 - 72%, State - 67%
- 2006 - 67%, State - 62%
8th Grade Science:
- 2011 - 46.2% on grade level (33% below basic). State – 58.3% of 8th graders were on grade level. Ranked 18th out of 19 eighth grades in the CSIU16 region.
- 2010 - 42%, State - 57%
- 2009 - 42%, State - 55%
- 2008 - 51%, State - 50%
7th Grade Reading:
- 2011 - 65.6% on grade level (15.7% below basic). State – 76%. Ranks last in CSIU 16 region middle schools for 7th grade reading.
- 2010 - 62% on grade level. State: 73% of 7th graders were on grade level.
- 2009 - 64%, State - 71%
- 2008 - 62%, State - 70%
- 2007 - 62%, State - 66%
7th Grade Math:
- 2011 - 79.1% on grade level (7.4% below basic). State - 78.6% Ranks 14th out of 19 middle schools in CSIU16 region.
- 2010 - 77%, State - 77%
- 2009 - 70%, State -75%
- 2008 - 70%, State - 70%
- 2007 - 77%, State - 67%
6th Grade Reading:
- 2011 - 65.7% on grade level (18.7% below basic). In Pennsylvania, 69.9% of 6th graders are on grade level. Ranked 17th out of 19 6th grades in CSIU 16 region.
- 2010 - 62%, State - 68%. Berwick ranked 15th out of 21 6th grades in the region for reading achievement.
- 2009 - 63%, State - 67%
- 2008 - 63%, State - 67%
- 2007 - 52%, State - 63%
6th Grade Math:
- 2011 - 80.9% on grade level (8% below basic). State - 78.8%. Ranks 14th out of 19 CSIU region 6th grades.
- 2010 - 81%, State - 78%
- 2009 - 78%, State - 78%
- 2008 - 76%, State - 72%
- 2007 - 71%, State - 69%
Elementary Schools
All four elementary schools achieved AYP status in 2011. All four achieved AYP status in 2010. The attendance rate ranged from 94% to 95%.- Salem Elementary School Academic Achievement Report Card 2010 http://www.scribd.com/doc/51363550/Berwick-Salem-Street-Elementary-School-Academic-Achievement-Report-Card-2010 | Report Card 2009 http://www.scribd.com/doc/28895573/Berwick-Salem-Elementary-School-Academic-Achievement-Report-Card-2009
- Orange Street School Academic Achievement Report Card 2010 http://www.scribd.com/doc/51363572/Berwick-Orange-Street-Elementary-School-Academic-Achievement-Report-Card-2010 | Report Card 2009 http://www.scribd.com/doc/28895615/Berwick-Orange-Street-School-Academic-Achievement-Report-Card-2009
- Nescopeck Elementary School Academic Achievement Report Card 2010 http://www.scribd.com/doc/51363641/Berwick-Nescopeck-Elementary-School-Academic-Achievement-Report-Card-2010 Report Card 2009 http://www.scribd.com/doc/28895676/Berwick-Nescopeck-Elementary-School-Academic-Achievement-Report-Card-2009
- 14th Street Elementary School Academic Achievement Report Card 2010 http://www.scribd.com/doc/51363680/Berwick-14th-Street-Elementary-School-Academic-Achievement-Report-Card-2010 | Report Card 2009 http://www.scribd.com/doc/28895719/Berwick-14th-Street-Elementary-School-Academic-Achievement-Report-Card-2009
21st Century Community Learning Center Grant
Berwick Area School District was designated as a before and after school program provider for Columbia and Luzerne Counties in 2010. They received state funding - a grant of $142,376. CCLCs provide academic, artistic and cultural enhancement activities to students and their families when school is not in session.Wellness policy
Berwick Area School Board established a district wellness policy in 2006 - Policy 246. The policy deals with nutritious meals served at school, the control of access to some foods and beverages during school hours, age appropriate nutrition education for all students, and physical education for students K-12. The policy is in response to state mandates and federal legislation (P.L. 108 - 265). The law dictates that each school district participating in a program authorized by the Richard B. Russell National School Lunch Act (42 U.S.C. 1751 et seq) or the Child Nutrition Act of 1966 (42 U.S.C. 1771 et seq) "shall establish a local school wellness policy by School Year 2006."The legislation placed the responsibility of developing a wellness policy at the local level so the individual needs of each district can be addressed. According to the requirements for the Local Wellness Policy, school districts must set goals for nutrition education, physical activity, campus food provision, and other school-based activities designed to promote student wellness. Additionally, districts were required to involve a broad group of individuals in policy development and to have a plan for measuring policy implementation. Districts were offered a choice of levels of implementation for limiting or prohibiting low nutrition foods on the school campus. In final implementation these regulations prohibit some foods and beverages on the school campus.
The Pennsylvania Department of Education required the district to submit a copy of the policy for approval.
Bullying policy
In 2009 the administrative reported there were 3 incidents of bullying in the district.The Berwick Area School Board prohibits bullying by district students and faculty. The policy defines bullying and cyberbullying. The Board directs that complaints of bullying shall be investigated promptly, and corrective action shall be taken when allegations are verified. No reprisals or retaliation shall occur as a result of good faith reports of bullying. The board expects staff members to be responsible to maintain an educational environment free from all forms of bullying. All Pennsylvania schools are required to have an anti-bullying policy incorporated into their Code of Student Conduct. The policy must identify disciplinary actions for bullying and designate a school staff person to receive complaints of bullying. The policy must be available on the school's website and posted in every classroom. All Pennsylvania public schools must provide a copy of its anti-bullying policy to the Office for Safe Schools every year, and shall review their policy every three years. Additionally, the district must conduct an annual review of that policy with students. The Center for Schools and Communities works in partnership with the Pennsylvania Commission on Crime & Delinquency and the Pennsylvania Department of Education to assist schools and communities as they research, select and implement bullying prevention programs and initiatives.
Education standards relating to student safety and antiharassment programs are described in the 10.3. Safety and Injury Prevention in the Pennsylvania Academic Standards for Health, Safety and Physical Education.
Special Education
In December 2009, the district administration reported that 595 pupils or 19% of the district's pupils received Special Education services.The District engages in identification procedures to ensure that eligible students receive an appropriate educational program consisting of special education and related services, individualized to meet student needs. At no cost to the parents, these services are provided in compliance with state and federal law; and are reasonably calculated to yield meaningful educational benefit and student progress. To identify students who may be eligible for special education, various screening activities are conducted on an ongoing basis. These screening activities include: review of group-based data (cumulative records, enrollment records, health records, report cards, ability and achievement test scores); hearing, vision, motor, and speech/language screening; and review by the Instructional Support Team or Student Assistance Team. When screening results suggest that the student may be eligible, the District seeks parental consent to conduct a multidisciplinary evaluation. Parents who suspect their child is eligible may verbally request a multidisciplinary evaluation from a professional employee of the District or contact the Supervisor of Special Education.
Budget
In 2009 the district reported employing over 250 teachers with a salary range of $31,400 to $78,676.In 2007, the district employed 232 teachers. The average teacher salary in the district was $53,787 for 180 days worked. The district's average teacher salary was the highest of all the Columbia County school districts in 2007. As of 2007, Pennsylvania ranked in the top 10 states in average teacher salaries. When adjusted for cost of living Pennsylvania ranked fourth in the nation for teacher compensation. Additionally, the teachers receive a defined benefit pension
Pension
In general, a pension is an arrangement to provide people with an income when they are no longer earning a regular income from employment. Pensions should not be confused with severance pay; the former is paid in regular installments, while the latter is paid in one lump sum.The terms retirement...
, health insurance
Health insurance
Health insurance is insurance against the risk of incurring medical expenses among individuals. By estimating the overall risk of health care expenses among a targeted group, an insurer can develop a routine finance structure, such as a monthly premium or payroll tax, to ensure that money is...
, professional development reimbursement, personal days, sick days, and other benefits. According to Rep. Glen Grell, a trustee of the state teacher retirement fund, a 40-year Pennsylvania public school educator can retire with a pension equal to 100 percent of their final salary.
The district administrative costs per pupil in 2008 were $455 per pupil. The lowest administrative cost per pupil in Pennsylvania was $398 per pupil. In February 2010, the school board approved a five year employment contract for superintendent with Wayne D. Brookhart effective July 1, 2010 through June 30, 2015.
In February 2010, the school board approved a plan to pay a $10,000 retirement bonus to classified staff (Secretaries, Custodial staff and/or Maintenance staff) that retired by the end of the 2009-2010 school year. Additionally, teachers who retired by June 2010 would be paid a bonus of $16,500 while administrators will receive a $10,000 bonus.
Reserves - In 2008, the district reported an unreserved designated fund balance of $4,750,000.00 and a unreserved-undesignated fund balance of $8,985,646.00.
The district is funded by a combination of: a local earned income tax, a property tax, a real estate transfer tax, grants, coupled with substantial funding from the Commonwealth of Pennsylvania and the federal government. In Pennsylvania, pension income and social security income are exempted from state income tax and local earned income tax regardless of the level of income.
State basic education funding
For 2010-11 the state allocated a 4.66% increase to Berwick Area School District for a total of $15,132,433. The highest increase among Columbia County school districts was given to Southern Columbia Area School DistrictSouthern Columbia Area School District
Southern Columbia Area School District is a small, rural school district located in Catawissa, Pennsylvania. It is in Columbia County and draws students from both Columbia and Northumberland counties. Southern Columbia Area School District encompasses approximately 108 square miles. According to...
with a 5.77% increase. One hundred fifty school districts received a base 2% increase. The highest increase in the state went to Kennett Consolidated School District
Kennett Consolidated School District
The Kennett Consolidated School District,or KCSD for short, is a public school district serving portions of Chester County, Pennsylvania. It is centered on the borough of Kennett Square and also incorporates Kennett Township, New Garden Township, and the southern portion of East Marlborough Twp....
located in Chester County
Chester County, Pennsylvania
-State parks:*French Creek State Park*Marsh Creek State Park*White Clay Creek Preserve-Demographics:As of the 2010 census, the county was 85.5% White, 6.1% Black or African American, 0.2% Native American or Alaskan Native, 3.9% Asian, 0.0% Native Hawaiian, 1.8% were two or more races, and 2.4% were...
, which received a 23.65% increase in state basic education funding.
In the 2009-2010 budget year the Commonwealth of Pennsylvania provided a 6.11% increase in Basic Education Funding for a total of $14,458,812. This was the highest percentage point increase, in Basic Education Funding, among the school districts in Columbia County. In Pennsylvania, twenty school districts received basic education funding increases over 10% in 2009. Across the Commonwealth ninety school districts received the base 2% increase in funding in 2009. Muhlenberg School District
Muhlenberg School District
The Muhlenberg Area School District is a public school district serving parts of Berks County, Pennsylvania, USA. It encompasses the borough of Laureldale and the Muhlenberg Township. The district encompasses approximately 13 square miles. Per the 2000 federal census data it serves a resident...
in Berks County received a 22.31% increase in state basic education funding in 2009. The state Basic Education Funding to the Berwick Area School District in 2008-09 was $13,626,386.29. The amount of increase each school district receives is determined by the Governor and the Secretary of Education through the allocation set in the state budget proposal made in February each year.
According to the Pennsylvania Department of Education, 1,251 students received free or reduced lunches due to low family income in the 2007-2008 school year.
Accountability Block Grants
Beginning in 2004-2005, the state launched the Accountability Block Grant school funding. This program has provided $1.5 billion to Pennsylvania’s school districts. The Accountability Block Grant program requires that its taxpayer dollars are focused on specific interventions that are most likely to increase student academic achievement. These interventions include: teacher training, All Day Kindergarten, lower class size K-3rd grade, literacy and math Coaching programs that provide teachers with individualized job-embedded professional development to improve their instruction, before or after school tutoring assistance to struggling students, For 2010-11 the district applied for and received $567,074 in addition to all other state and federal funding. The district uses the funding to provide Increased Instructional Time and Full Day Kindergarten.- 2009-10 - $567,074 for Increased Instructional Time - tutoring and Full Day Kindergarten for the 5th year.
- 2008-09 - $567,074 for Increased instructional Time and Full Day Kindergarten.
Education Assistance Grant
The state's EAP funding provides for the continuing support of tutoring services and other programs to address the academic needs of eligible students. Funds are available to eligible school districts and full-time career and technology centers (CTC) in which one or more schools have failed to meet at least one academic performance target, as provided for in Section 1512-C of the Pennsylvania Public School Code. In 2010-11 the Berwick Area School District received $74,531.Classrooms for the Future grant
The Classroom for the Future state program provided districts with hundreds of thousands of extra state funding to buy laptop computers for each core curriculum high school class (English, Science, History, Math) and funded mandatory teacher training to optimize the instructional use of the computers. The program was funded from 2006-2009. Berwick Area School District received $52,843 in 2006-07. In 2007-08 the district received $300,000 and in 2008-09 $50,603 for a total of $403,446.Federal Stimulus Grant
The district received an extra $2,937,591 in ARRAArra
Arra is a census town in Puruliya district in the state of West Bengal, India.-Demographics: India census, Arra had a population of 19,911. Males constitute 52% of the population and females 48%. Arra has an average literacy rate of 66%, higher than the national average of 59.5%; with 59% of the...
- Federal Stimulus money to be used in specific programs like special education and meeting the academic needs of low income students.
The funding is for the 2009-10 and 2010-2011 school years.
Race to the Top grant
School district officials did not apply for the Race to the TopRace to the Top
Race to the Top, abbreviated R2T, RTTT or RTT, is a $4.35 billion United States Department of Education competition designed to spur innovation and reforms in state and local district K-12 education...
federal grant. When approved for the grant, the district would have receives over one million dollars of additional federal dollars for improving student academic achievement. Participation required the administration, the school board and the local teachers' union to sign an agreement to prioritize improving student academic success. In Pennsylvania, 120 public school districts and 56 charter schools agreed to participate. Pennsylvania was not approved for the grant. The failure of districts to agree to participate was cited as one reason that Pennsylvania was not approved.
Common Cents state initiative
The school board elected to not participate in the Pennsylvania Department of Education Common Cents program. The program called for the state to audit the district, at no cost to local taxpayers, to identify ways the district could save tax dollars. After the review of the information, the district was not required to implement the recommended cost savings changeReal estate taxes
For the 2010-11 school year, the Berwick school board levied property taxes at: 45.0000 mills for residents in Columbia County and 11.0000 mills for Luzerne County residents. A mill is $1 of tax for every $1,000 of a property's assessed value. Irregular property reassessments have become a serious issue in the commonwealth as it creates a significant disparity in taxation within a community and across a region. On the local level, Pennsylvania district revenues are dominated by two main sources: 1) Property tax collections, which account for the vast majority (between 75-85%) of local revenues; and 2) Act 511 tax collections, which are around 15% of revenues for school districts.- 2009-10 - 48.1500 mills for properties in Columbia County and 9.9100 mills for Luzerne County properties.
- 2008-09 - 48.1000 mills for Columbia County and 219.5000 mills for Luzerne County.
- 2007-08 - 49.1000 mills for Columbia County and 219.5000 mills for Luzerne County.
Property tax rates vary within the school district, depending on where the property is located. School districts located in more than one county are required to apportion the tax levy based on the market value in each county as determined by the State Tax Equalization Board pursuant to section 672.1 of the School Code. As a result, the tax rate increases are not the same for each county in a multi-county school district.
Act 1 Adjusted index
The Act 1 of 2006 Index regulates the rates at which each school district can raise property taxes in Pennsylvania. Districts are not allowed to raise taxes above that index unless they allow voters to vote by referendum, or they seek an exception from the state Department of Education. The base index for the 2010-2011 school year is 1.4 percent, but it can be adjusted higher, depending on a number of factors, such as property values and the personal income of district residents. Act 1 included 10 exceptions including: increasing pension costs, increases in special education costs, a catastrophe like a fire or flood, increasing rising health care costs for contracts in effect in 2006 or dwindling tax bases. The base index is the average of the percentage increase in the statewide average weekly wage, as determined by the PA Department of Labor and Industry, for the preceding calendar year and the percentage increase in the Employment Cost Index for Elementary and Secondary Schools, as determined by the Bureau of Labor StatisticsBureau of Labor Statistics
The Bureau of Labor Statistics is a unit of the United States Department of Labor. It is the principal fact-finding agency for the U.S. government in the broad field of labor economics and statistics. The BLS is a governmental statistical agency that collects, processes, analyzes, and...
in the U.S. Department of Labor, for the previous 12-month period ending June 30. For a school district with a market value/personal income aid ratio (MV/PI AR) greater than 0.4000, its index equals the base index multiplied by the sum of .75 and its MV/PI AR for the current year.
The School District Adjusted Index for the Berwick Area School District 2006-2007 through 2010-2011.
- 2006-07 - 5.4%, Base 3.9%
- 2007-08 - 4.7%, Base 3.4%
- 2008-09 - 6.1%, Base 4.4%
- 2009-10 - 5.8%, Base 4.1%
- 2010-11 - 4.1%, Base 2.9%
- 2011-12 - 2.0%, Base 1.4%
- 2012-13 - 2.4%, Base 1.7%
For the 2009-10 school year budget, the 2010-11 budget and the 2011-12 budget, the Berwick Area School Board did not apply for any exceptions to exceed the district's Act 1 Index limit. Each year, the school district has the option of adopting either 1) a resolution in January certifying they will not increase taxes above their index or 2) a preliminary budget in February. A school district adopting the resolution may not apply for referendum exceptions or ask voters for a tax increase above the inflation index. A specific timeline for these decisions is publisher each year by the Pennsylvania Department of Education.
For the 2011-2012 school year budgets, 247 school districts adopted a resolution certifying that tax rates would not be increased above their index; 250 school districts adopted a preliminary budget. Of the 250 school districts that adopted a preliminary budget, 231 adopted real estate tax rates that exceeded their index. Tax rate increases in the other 19 school districts that adopted a preliminary budget did not exceed the school district’s index. Of the districts who sought exceptions 221 used the pension costs exemption and 171 sought a Special Education costs exemption. Only 1 school district sought an exemption for Nonacademic School Construction Project, while 1 sought an exception for Electoral debt for school construction.
In the Spring of 2010, 135 Pennsylvania school boards applied to the PDE for permission to exceed their adjusted index. Approval was granted to 133 of them and 128 sought an exception for pension costs increases.
Property tax relief
In 2010, property tax relief was set at $180 for the 6,078 homesteads and farmsteads that applied. In 2009, the Homestead/Farmstead Property Tax Relief from gambling for Berwick Area School District was $181 per approved permanent primary residence. In the district, 6,031 property owners applied for the tax relief. The highest property tax relief, in Columbia County, was $225 given in Benton Area School DistrictBenton Area School District
The Benton Area School District is a small, rural, public school district. It encompasses 96.8 square miles. It covers the Boroughs of Benton and Stillwater and Benton Township, Fishing Creek Township, Jackson Township and Sugarloaf Township in Columbia County, Pennsylvania. The district operates...
. The relief was subtracted from the total annual school property tax bill. Property owners apply for the relief through the county Treasurer's office. Farmers can qualify for a farmstead exemption on building used for agricultural purposes. The farm must be at least 10 acres (40,468.6 m²) and must be the primary residence of the owner. Farmers can qualify for both the homestead exemption and the farmstead exemption. In Columbia County, 71% of property owners applied for the rebate in 2009. Pennsylvania awarded the highest property tax relief to residents of the Chester-Upland School District in Delaware County
Delaware County, Pennsylvania
Delaware County is a county located in the U.S. state of Pennsylvania. As of 2010, the population was 558,979, making it Pennsylvania's fifth most populous county, behind Philadelphia, Allegheny, Montgomery, and Bucks counties....
at $632 per homestead and farmstead in 2010. This was the second year they were the top recipient.
Additionally, the Pennsylvania Property Tax/Rent Rebate program is provided for low income Pennsylvanians aged 65 and older; widows and widowers aged 50 and older; and people with disabilities age 18 and older. The income limit is $35,000 for homeowners. The maximum rebate for both homeowners and renters is $650. Applicants can exclude one-half (1/2) of their Social Security income, so people who make substantially more than $35,000 may still qualify for a rebate. Individuals must apply annually for the rebate.
The Tax Foundation reports that Pennsylvania ranked 11th in the U.S. in 2008 in terms of property taxes paid as a percentage of home value (1.34%) and 12th in the country in terms of property taxes as a percentage of income (3.55%).
Extracurriculars
The district offers a variety of clubs, activities and sports. Eligibility for participation is determined by school board policy.By Pennsylvania law, all K-12 students in the district, including those who attend a private nonpublic school, cyber charter school, charter school and those homeschooled, are eligible to participate in the extracurricular programs including all athletics. They must meet the same eligibility rules as the students enrolled in the district's schools.