
.gif)
Wind power generation in New Zealand (2007)
Encyclopedia
This page summarises wind power generation in New Zealand for 2007.
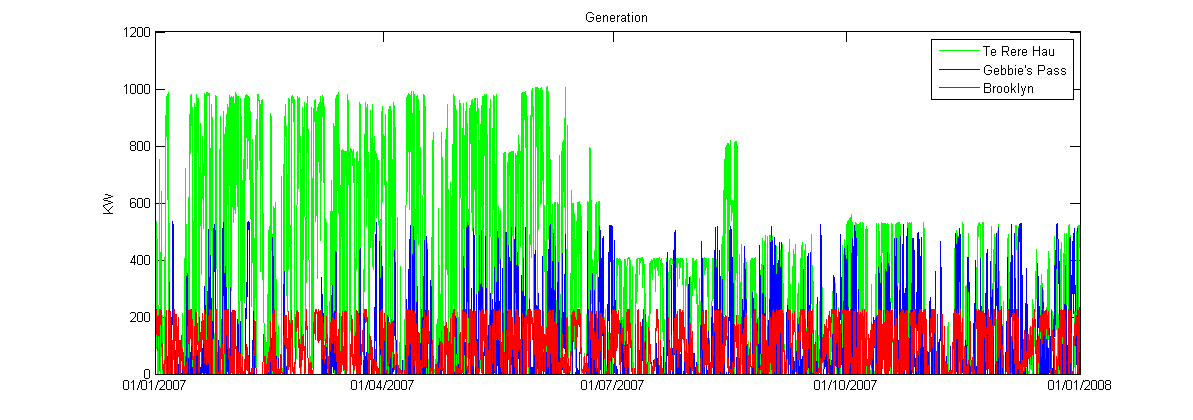
There are isolated wind turbines at Brooklyn and Gebbie's Pass. At the Te Rere Hau wind farm there are five 500KW wind turbines, however the transmission line to the rest of the electricity grid is limited to one megawatt. The horizontal layering shows the effect of a single turbine (or a small number of turbines) running at their maximum output. For Te Rere Hau however, the graph suggests that this maximum setting is about 200KW, not the nominated 500KW.
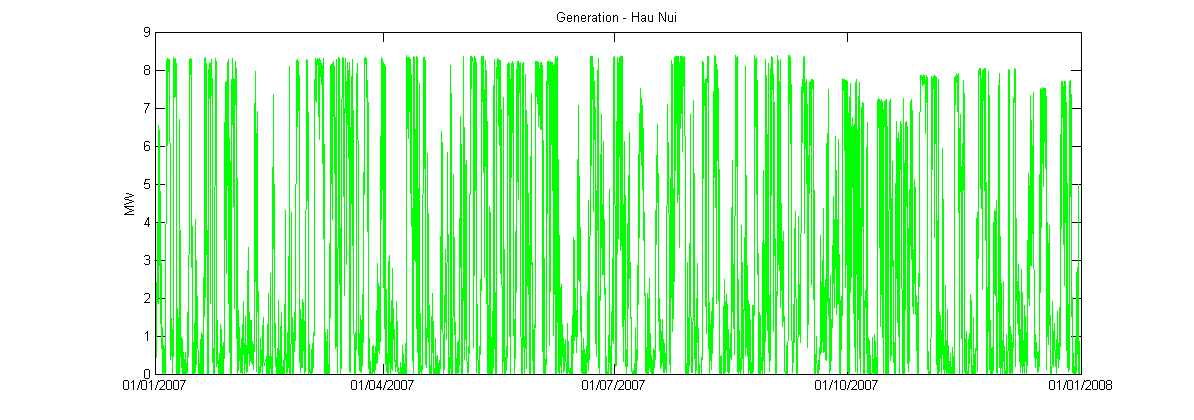
The Hau Nui wind farm has an intermediate capacity...
While south of the Manawatu Gorge the Tararua wind farms operate almost in synchrony. Construction of the Tararua III wind farm began in early 2007, but after winter some turbines became u/s.

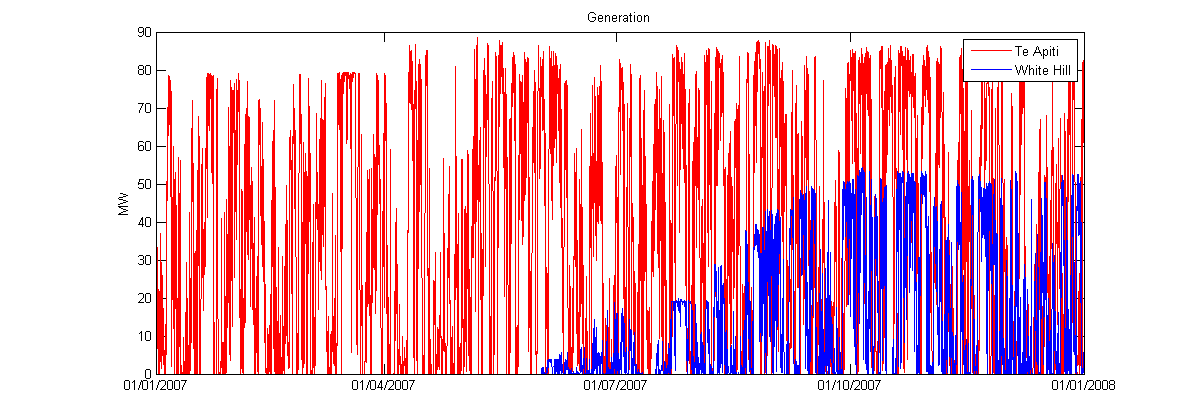
North of the Manawatu Gorge is the Te Apiti wind farm, while in Southland the White Hill wind farm began operation.
Combining all the wind generation shows that the total production was uneven over the year due to variations in capacity.

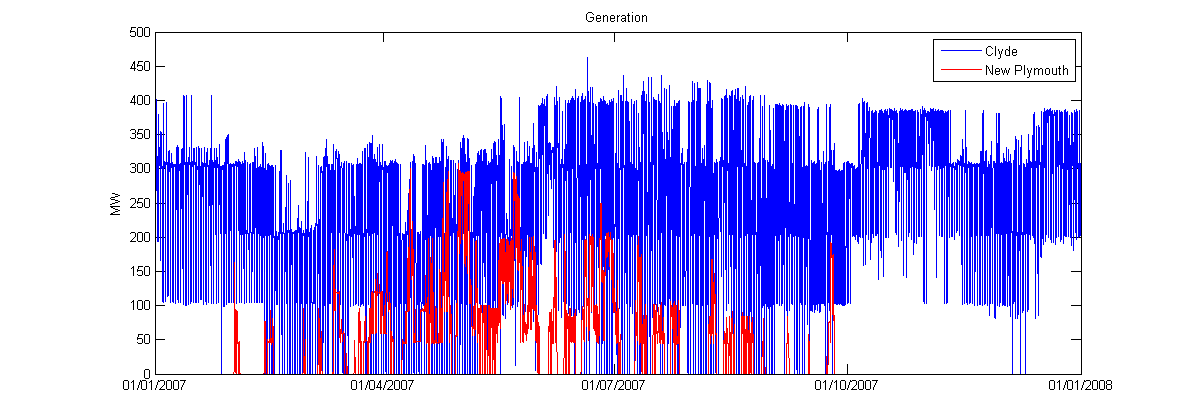
By contrast, the Clyde hydro power station (for example) has its generation timed to suit demand, likewise the New Plymouth thermal power station - which was deactivated in October 2007, until the resulting power shortages in 2008 encouraged its partial reactivation.
This can be assessed via consideration of the "duration" curve, of power vs. the proportion of time at (or below) that power, derived from the observed generation data for some interval such as a year. Specifically, given measurements at regular intervals (half-hourly is usual in NZ), as were used to produce the plots of generation, sort a year's 17520 values into the order lowest power to highest. A plot of the power as the y-variable and the index of the value's position as the x-variable produces curves such as follow.
For wind power, there is no controllability, except in design choices as to wind speeds for start and stop, so the power output is closely connected to the wind speed.
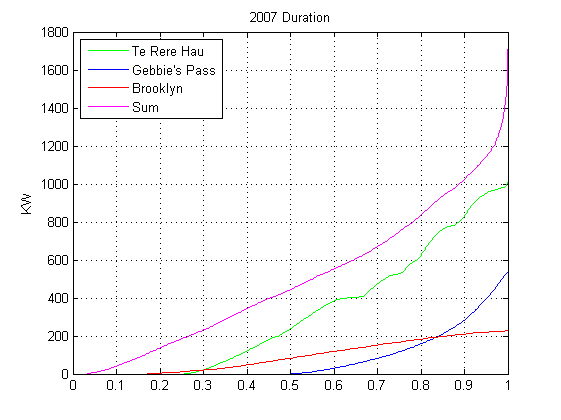
These curves are rather disappointing. For Te Rere Hau for example, the top tenth of the time for generation involves a power drop of two tenths. Half the time, the generation is less than 25% of full capacity. For about forty percent of the time the generation is less than ten percent of nominal capacity, a level that is hardly worth the trouble and it is zero for about a quarter of the time. Since the timing of the pattern of demand for electricity is not much correlated with the wind, this means that at any particular time of high demand, it will be unlikely that wind generation is operating at high power.
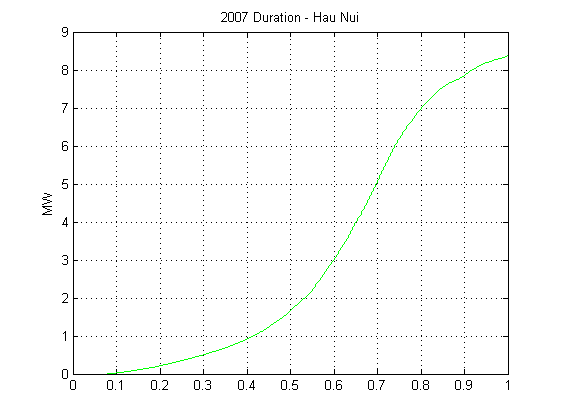
Perhaps a wind farm with many turbines and unconstrained by transmission line capacities will do better: here is the curve for the Hau Nui wind farm
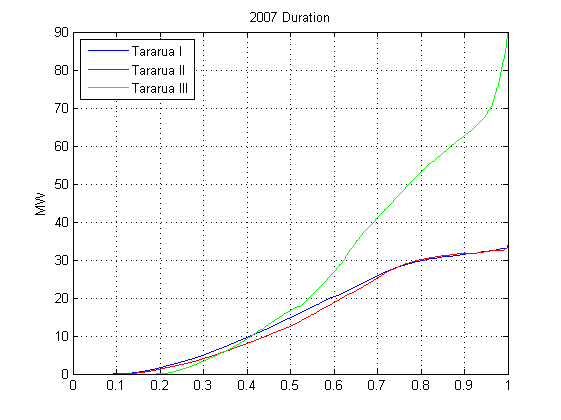
And the Tararua wind farms, distorted by the increase of capacity for Tararua III during 2007.
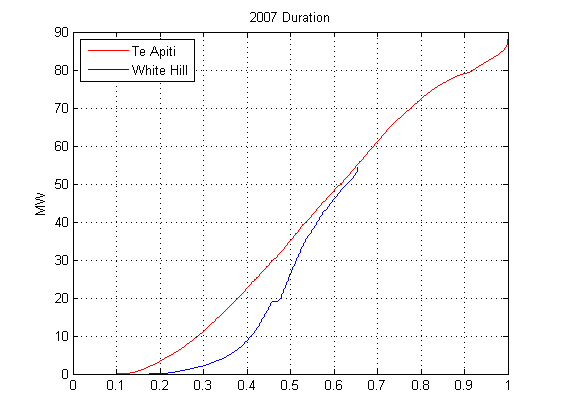
And Te Apiti (north of the Tararua wind farm) along with White Hill in Southland which commenced operation in 2007.
And for all wind combined, distorted by the changes in active capacity during 2007:
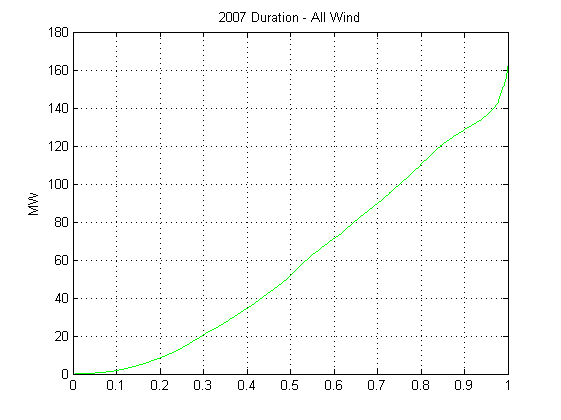
The combined curve is not the summation of the individual duration curves; rather, for each time the values for the wind-powered generation at that time were added, and the sort performed on the sum. Despite the geographical spread, it is clear that at any given time, there is a high chance that the contribution from wind generation will not be a large proportion of the installed capacity. For instance, half the time, it will be no more than a third, and only a quarter of the time will it be above two thirds.
Scrutiny of the generation plots shows that the adjacent wind farms Tararua I and II are steady (and almost the same), and Te Apiti, on the north side of the Manawatu Gorge is likewise steady. So for two nearby wind farms,
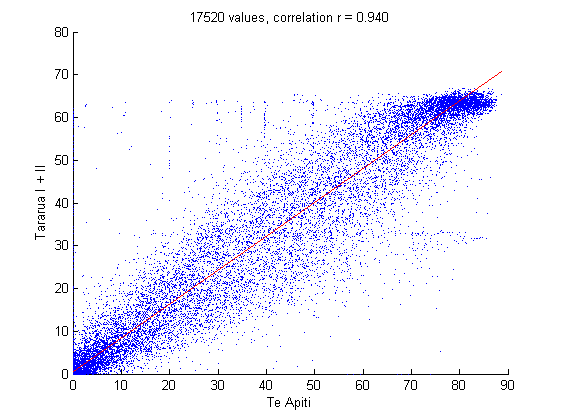
This shows that the two operate almost as one. Further, when the wind is strong north of the gorge it is also strong south of the gorge, and vice-versa. The lone wind turbine at Brooklyn above Wellington is rather further away, and unlike Hau Nui, the Rimutaka mountain range intervenes between it and Te Apiti.
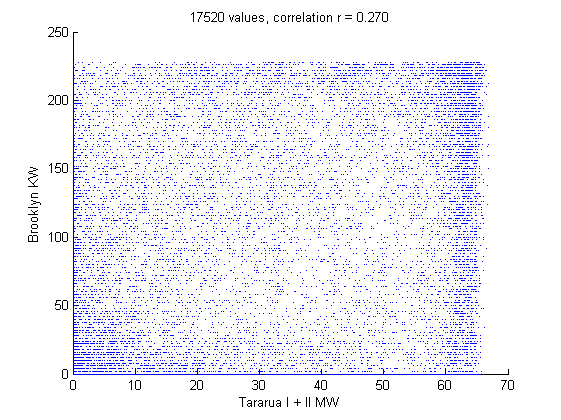
This shows very little correlation, though still when the wind is strong (or weak) at one location it is likewise at the other. The obtrusive horizontal layering is a consequence of the data supplied being given only to a 2KW step even though the full scale value is just 230KW and the metering is good to one part in ten thousand.
Much further away is the lone wind turbine at Gebbie's Pass by Christchurch.
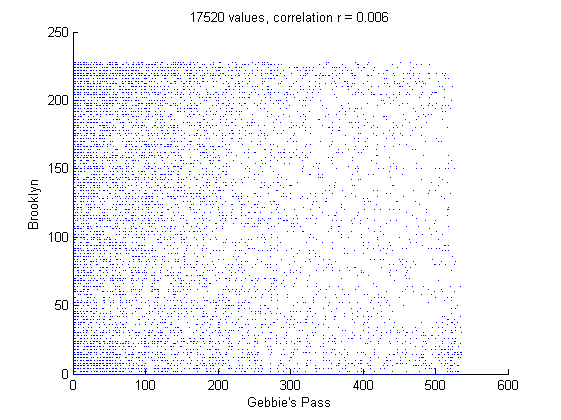
Which shows no correlation. However, times when there was no generation at both locations would not be well-depicted in this display.
By contrast, the Clyde hydro power station has controllable generation. It has four turbines and the steps in the duration curve show that one, two, three or four turbines (but not which individual turbines) were operating at their nominal output for various portions of the year. Thus, the Clyde power station was not generating at all for about a twentieth of the year (zero power up to about 0.05 of a year) and ran one turbine only for about a tenth of a year, the flat between 0.1 and 0.2. A hydro turbine is at its most efficient only near its design capacity and the flow of water is controlled accordingly. However, the power output can be varied a little (and the water pressure varies with lake level), nor need the operational level be changed only on half-hour boundaries, so the "flats" of the staircase are not completely flat nor the risers vertical. For new Plymouth, for two thirds of the year's half-hours it was not running at all.

Now, it is true that a hydro power station does not operate at a hundred percent all the time, but this is not the same thing. Clyde runs at about 60% of its capacity, but this is because a hydro power station typically has more generation installed than could be supplied by the annual average flow of its river. Given that a hydro power station is being built, an extra generator is not much further expense. The difference is that the excess generation can be started or stopped as the demand for electricity varies, with the water reservoir either falling or rising correspondingly, but averaged over a long period the flow through the generators matches the river's actual flow since otherwise the lake will overflow or be drained. With wind turbines there is no storage of wind for other times of greater need. Thus a hydro power station has good availability (for any given half-hour) while a wind power station does not, even if both offer about the same ratio of average power to maximum power over a year.
Wind power generation
Electricity generation via wind turbines is uncontrolled, in that the wind blows or not irrespective of the timing of the demand for electricity. Measurements of the generation over half-hourly intervals are supplied to the Electricity Commission.There are isolated wind turbines at Brooklyn and Gebbie's Pass. At the Te Rere Hau wind farm there are five 500KW wind turbines, however the transmission line to the rest of the electricity grid is limited to one megawatt. The horizontal layering shows the effect of a single turbine (or a small number of turbines) running at their maximum output. For Te Rere Hau however, the graph suggests that this maximum setting is about 200KW, not the nominated 500KW.
The Hau Nui wind farm has an intermediate capacity...
While south of the Manawatu Gorge the Tararua wind farms operate almost in synchrony. Construction of the Tararua III wind farm began in early 2007, but after winter some turbines became u/s.
North of the Manawatu Gorge is the Te Apiti wind farm, while in Southland the White Hill wind farm began operation.
Combining all the wind generation shows that the total production was uneven over the year due to variations in capacity.
By contrast, the Clyde hydro power station (for example) has its generation timed to suit demand, likewise the New Plymouth thermal power station - which was deactivated in October 2007, until the resulting power shortages in 2008 encouraged its partial reactivation.
Availability over a year
An important consideration for the organisation of an electric power generation system is the availability of power from its various components. Hydro power stations with a reasonably large lake can be started and stopped at will, while thermal power stations are controllable also, though cycling between hot and cold causes wear and is to be avoided. Wind turbines of course generate only at the whim of the wind, so the question becomes "How often does the wind blow at useful rates?" From the viewpoint of the electricity system, this becomes "How often does the generator deliver various levels of power?"This can be assessed via consideration of the "duration" curve, of power vs. the proportion of time at (or below) that power, derived from the observed generation data for some interval such as a year. Specifically, given measurements at regular intervals (half-hourly is usual in NZ), as were used to produce the plots of generation, sort a year's 17520 values into the order lowest power to highest. A plot of the power as the y-variable and the index of the value's position as the x-variable produces curves such as follow.
For wind power, there is no controllability, except in design choices as to wind speeds for start and stop, so the power output is closely connected to the wind speed.
These curves are rather disappointing. For Te Rere Hau for example, the top tenth of the time for generation involves a power drop of two tenths. Half the time, the generation is less than 25% of full capacity. For about forty percent of the time the generation is less than ten percent of nominal capacity, a level that is hardly worth the trouble and it is zero for about a quarter of the time. Since the timing of the pattern of demand for electricity is not much correlated with the wind, this means that at any particular time of high demand, it will be unlikely that wind generation is operating at high power.
Perhaps a wind farm with many turbines and unconstrained by transmission line capacities will do better: here is the curve for the Hau Nui wind farm
And the Tararua wind farms, distorted by the increase of capacity for Tararua III during 2007.
And Te Apiti (north of the Tararua wind farm) along with White Hill in Southland which commenced operation in 2007.
And for all wind combined, distorted by the changes in active capacity during 2007:
The combined curve is not the summation of the individual duration curves; rather, for each time the values for the wind-powered generation at that time were added, and the sort performed on the sum. Despite the geographical spread, it is clear that at any given time, there is a high chance that the contribution from wind generation will not be a large proportion of the installed capacity. For instance, half the time, it will be no more than a third, and only a quarter of the time will it be above two thirds.
Correlation between different locations
So the next question is just how much correlation might there be amongst wind power installations at different locations? Perhaps when the wind fails to blow at one location, it might blow at another. This can be assessed by considering scatter plots where a point is placed for each measurement of the year according to station A's generation at that time for the x co-ordinate and station B's generation for the y co-ordinate. A fair comparison would be amongst stations that have not changed during the year, so this means that White Hill and Tararua III that were under construction in 2007 must be excluded. A later time span could be used when they have settled down, but incompetence within the electricity commission has meant that data for wind generation (and many other smaller generation stations) is no longer being received.Scrutiny of the generation plots shows that the adjacent wind farms Tararua I and II are steady (and almost the same), and Te Apiti, on the north side of the Manawatu Gorge is likewise steady. So for two nearby wind farms,
This shows that the two operate almost as one. Further, when the wind is strong north of the gorge it is also strong south of the gorge, and vice-versa. The lone wind turbine at Brooklyn above Wellington is rather further away, and unlike Hau Nui, the Rimutaka mountain range intervenes between it and Te Apiti.
This shows very little correlation, though still when the wind is strong (or weak) at one location it is likewise at the other. The obtrusive horizontal layering is a consequence of the data supplied being given only to a 2KW step even though the full scale value is just 230KW and the metering is good to one part in ten thousand.
Much further away is the lone wind turbine at Gebbie's Pass by Christchurch.
Which shows no correlation. However, times when there was no generation at both locations would not be well-depicted in this display.
By contrast, the Clyde hydro power station has controllable generation. It has four turbines and the steps in the duration curve show that one, two, three or four turbines (but not which individual turbines) were operating at their nominal output for various portions of the year. Thus, the Clyde power station was not generating at all for about a twentieth of the year (zero power up to about 0.05 of a year) and ran one turbine only for about a tenth of a year, the flat between 0.1 and 0.2. A hydro turbine is at its most efficient only near its design capacity and the flow of water is controlled accordingly. However, the power output can be varied a little (and the water pressure varies with lake level), nor need the operational level be changed only on half-hour boundaries, so the "flats" of the staircase are not completely flat nor the risers vertical. For new Plymouth, for two thirds of the year's half-hours it was not running at all.
Now, it is true that a hydro power station does not operate at a hundred percent all the time, but this is not the same thing. Clyde runs at about 60% of its capacity, but this is because a hydro power station typically has more generation installed than could be supplied by the annual average flow of its river. Given that a hydro power station is being built, an extra generator is not much further expense. The difference is that the excess generation can be started or stopped as the demand for electricity varies, with the water reservoir either falling or rising correspondingly, but averaged over a long period the flow through the generators matches the river's actual flow since otherwise the lake will overflow or be drained. With wind turbines there is no storage of wind for other times of greater need. Thus a hydro power station has good availability (for any given half-hour) while a wind power station does not, even if both offer about the same ratio of average power to maximum power over a year.