

Treemapping
Encyclopedia
Information visualization
Information visualization is the interdisciplinary study of "the visual representation of large-scale collections of non-numerical information, such as files and lines of code in software systems, library and bibliographic databases, networks of relations on the internet, and so forth".- Overview...
and computing
Computing
Computing is usually defined as the activity of using and improving computer hardware and software. It is the computer-specific part of information technology...
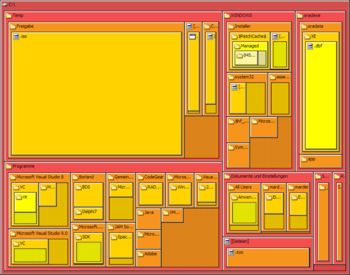
, treemapping is a method for displaying hierarchical data by using nested
Nesting (computing)
In computing science and informatics, the word nesting may denote several different constructions and activities where information is organized in layers or objects contain other similar objects. The rather general term is thus used in quite specific ways for various situations and concepts...
rectangles.
Main idea
Treemaps display hierarchical (tree-structured) data as a set of nested rectangles. Each branch of the tree is given a rectangle, which is then tiled with smaller rectangles representing sub-branches. A leaf node's rectangle has an area proportional to a specified dimension on the data. Often the leaf nodes are colored to show a separate dimension of the dataDimension (metadata)
In metadata, dimension is a set of equivalent units of measure, where equivalence between two units of measure is determined by the existence of a quantity preserving one-to-one correspondence between values measured in one unit of measure and values measured in the other unit of measure,...
.
When the color and size dimensions are correlated in some way with the tree structure, one can often easily see patterns that would be difficult to spot in other ways, for example, if a certain color is particularly relevant. A second advantage of treemaps is that, by construction, they make efficient use of space. As a result, they can legibly display thousands of items on the screen simultaneously.
The tiling algorithm
To create a treemap, one must define a tilingTiling
Tiling may refer to:* The physical act of laying tiles* The mathematics of tessellations* The compiler optimization of loop tiling* In computing, a tiling window manager, where windows do not overlap...
algorithm
Algorithm
In mathematics and computer science, an algorithm is an effective method expressed as a finite list of well-defined instructions for calculating a function. Algorithms are used for calculation, data processing, and automated reasoning...
, that is, a way to divide a rectangle into sub-rectangles of specified areas.
Ideally, a treemap algorithm would create rectangles of aspect ratio
Aspect ratio (image)
The aspect ratio of an image is the ratio of the width of the image to its height, expressed as two numbers separated by a colon. That is, for an x:y aspect ratio, no matter how big or small the image is, if the width is divided into x units of equal length and the height is measured using this...
close to one, would furthermore preserve some sense of the ordering in the input data, and would change to reflect changes in the underlying data. Unfortunately, these properties have an inverse relationship. As the aspect ratio is optimized, the order of placement becomes less predictable. As the order becomes more stable, the aspect ratio is degraded.
To date, six primary rectangular treemap algorithms have been developed:
| Algorithm | Order | Aspect ratios | Stability |
|---|---|---|---|
| BinaryTree | partially ordered | high | stable |
| Mixed Treemaps | ordered | lowest | stable |
| Ordered | partially ordered | medium | medium stability |
| Slice And Dice | ordered | very high | stable |
| Squarified | unordered | lowest | medium stability |
| Strip | ordered | medium | medium stability |
In addition, several algorithms have been proposed that use non-rectangular regions:
- Jigsaw Treemaps - based on the geometry of space-filling curves
- Voronoi Treemaps - based on voronoi diagramVoronoi diagramIn mathematics, a Voronoi diagram is a special kind of decomposition of a given space, e.g., a metric space, determined by distances to a specified family of objects in the space...
calculations - Convex Treemaps - convex polygons are used instead of rectangles
History
Area-based visualizations have existed for decades. Mosaic plots and Marimekko diagrams both use rectangular tilings to show joint distributions, for example. The main distinguishing feature of a treemap, however, is the recursive construction that allows it to be extended to hierarchical data with any number of levels. This idea was invented by University of Maryland, College ParkUniversity of Maryland, College Park
The University of Maryland, College Park is a top-ranked public research university located in the city of College Park in Prince George's County, Maryland, just outside Washington, D.C...
professor Ben Shneiderman
Ben Shneiderman
Ben Shneiderman is an American computer scientist, and professor for Computer Science at the Human-Computer Interaction Laboratory at the University of Maryland, College Park...
in the early 1990s. Shneiderman and his collaborators then deepened the idea by introducing a variety of interactive techniques for filtering and adjusting treemaps.
These early treemaps all used the simple "slice-and-dice" tiling algorithm. Despite many desirable properties (it is stable, preserves ordering, and is easy to implement), the slice-and-dice method often produces tilings with many long, skinny rectangles. In 1994 Hascoet & Beaudouin-Lafon invented a "squarifying" algorithm, later popularized by Jarke van Wijk, that created tilings whose rectangles were closer to square. In 1999 Martin Wattenberg
Martin M. Wattenberg
Martin M. Wattenberg is an American scientist and artist known for his work with data visualization. Along with Fernanda Viégas, he worked at the Cambridge location of IBM's Thomas J. Watson Research Center as part of the Visual Communication Lab, and created Many Eyes...
used a variation of the "squarifying" algorithm that he called "pivot and slice" to create the first Web-based treemap, the SmartMoney Map of the Market, which displayed data on hundreds of companies in the U.S. stock market. Following its launch, treemaps enjoyed a surge of interest, especially in financial contexts.
A third wave of treemap innovation came around 2004, after Marcos Weskamp created the Newsmap, a treemap that displayed news headlines. This example of a non-analytical treemap inspired many imitators, and introduced treemaps to a new, broad audience. In recent years, treemaps have made their way into the mainstream media, including usage by the New York Times.
See also
- Disk space analyzerDisk space analyzerA disk space analyzer is a software utility for the visualization of disk space usage by getting the size for each folder and files in a folder or drive...
- Information visualizationInformation visualizationInformation visualization is the interdisciplinary study of "the visual representation of large-scale collections of non-numerical information, such as files and lines of code in software systems, library and bibliographic databases, networks of relations on the internet, and so forth".- Overview...
- List of treemapping software
External links
- An article by Ben Shneiderman on the use of treemaps (as a guest on www.perceptualedge.comhttp://www.perceptualedge.com)
- Brief Survey of Treemap Techniques
- Comprehensive survey and bibliography of Tree Visualization techniques
- Generalized treemaps
- Generating a treemap using R (free open source statistical programming language) from the R-Project
- History of Treemaps by Ben Shneiderman.
- HTML5 Canvas Treemap by Paulo Poiati.
- Hypermedia exploration with interactive dynamic maps Paper by Hascoet and Beaudouin-Lafon introducing the squarified treemap layout algorithm (named "improved treemap layout" at the time).
- Indiana University description
- Live interactive treemap based on crowd-sourced discounted deals from Flytail Group
- Market Risk Analytics using Interactive Treemap from Panopticon SoftwarePanopticon SoftwarePanopticon Software is a multi-national Data Visualization software company specializing in monitoring and analysis of real-time data. The firm is headquartered in Stockholm, Sweden, with additional offices in New York City, London, Boston and partner agreements for other markets around the world...
- Online treemap of MICEX stock exchange
- Treemap sample in English from The Hive GroupThe Hive GroupThe Hive Group is a software company that applies visualization technology in operational intelligence , business intelligence , and complex event processing contexts...
- Several treemap examples made with MacrofocusMacrofocusMacrofocus is a Swiss software company focusing on data visualization. Macrofocus' products can be used to graphically explore large and complex datasets, with Macrofocus InfoScope being a general-purpose tool. Macrofocus SurveyVisualizer specializes on survey datasets and Macrofocus TreeMap...
TreeMapMacrofocus TreeMapMacrofocus TreeMap is an information visualization software package that produces different kinds of heat or tree maps using source data from common software packages , SQL databases or online data sources such as Yahoo! Finance... - Visualizations using dynamic treemaps and treemapping software by drasticdata