

School District of Lancaster
Encyclopedia
Urban area
An urban area is characterized by higher population density and vast human features in comparison to areas surrounding it. Urban areas may be cities, towns or conurbations, but the term is not commonly extended to rural settlements such as villages and hamlets.Urban areas are created and further...
school district
School district
School districts are a form of special-purpose district which serves to operate the local public primary and secondary schools.-United States:...
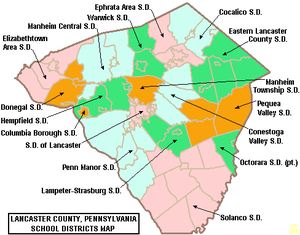
of 11,300 students educated in 19 schools in central Lancaster County, Pennsylvania
Lancaster County, Pennsylvania
Lancaster County, known as the Garden Spot of America or Pennsylvania Dutch Country, is a county located in the southeastern part of the Commonwealth of Pennsylvania, in the United States. As of 2010 the population was 519,445. Lancaster County forms the Lancaster Metropolitan Statistical Area, the...
. Established in 1836, it is the second oldest school district in the state. School District of Lancaster encompasses approximately 11 square miles. According to 2000 federal census data, it serves a resident population of 70,348. The School District of Lancaster serves a racially and economically diverse population of approximately 11,760 students: 55.5% Hispanic, 22.7% African American, 19.5% Caucasian, 2.3% Asian/other. In 2009, the district residents' per capita income
Per capita income
Per capita income or income per person is a measure of mean income within an economic aggregate, such as a country or city. It is calculated by taking a measure of all sources of income in the aggregate and dividing it by the total population...
was $16,273 a year, while the median family income was $38,429. According to District officials, in school year 2007-08 the School District of Lancaster provided basic educational services to 11,591 pupils through the employment of 990 teachers, 524 full-time and part-time support personnel, and 129 administrators. The School District of Lancaster received more than $63.9 million in state funding in school year 2007-08. The budget was $162 million for the 2009-2010 school year. The district is a member of Lancaster-Lebanon Intermediate Unit (IU) 13.
The District operates: one early childhood center, thirteen elementary schools, four middle schools, one high school campus and two alternative schools. It employs 1,620 staff members, including administrators, teachers, counselors, and support staff.
Governance
The school district is governed by 9 individually elected board members (serve four year terms), the Pennsylvania State Board of Education, the Pennsylvania Department of EducationPennsylvania Department of Education
The Pennsylvania Department of Education is the executive department of the state charged with K-12 and adult educational budgeting, management and guidelines. As the state education agency, its activities are directed by Pennsylvania's Secretary of Education, Gerald L. Zahorchak...
and the Pennsylvania General Assembly
Pennsylvania General Assembly
The Pennsylvania General Assembly is the state legislature of the U.S. state of Pennsylvania. The legislature convenes in the State Capitol building in Harrisburg. In colonial times , the legislature was known as the Pennsylvania Provincial Assembly. Since the Constitution of 1776, written by...
. The federal government controls programs it funds like Title I funding for low income children in the Elementary and Secondary Education Act
Elementary and Secondary Education Act
The Elementary and Secondary Education Act , is a United States federal statute enacted April 11, 1965. It was passed as a part of President Lyndon B. Johnson's "War on Poverty" and has been the most far-reaching federal legislation affecting education ever passed by Congress...
and the No Child Left Behind Act
No Child Left Behind Act
The No Child Left Behind Act of 2001 is a United States Act of Congress concerning the education of children in public schools.NCLB was originally proposed by the administration of George W. Bush immediately after he took office...
which mandates the district focus resources on student success in acquiring reading and math skills.
The Commonwealth Foundation for Public Policy Alternatives Sunshine Review gave the school board and district administration a "C-" for transparency based on a review of "What information can people find on their school district's website". It examined the school district's website for information regarding; taxes, the current budget, meetings, school board members names and terms, contracts, audits, public records information and more.
Academic Achievement
In 2011, the School District of Lancaster ranked 487th out of 498 Pennsylvania districts. The ranking is based on five years of student academic achievement as demonstrated by PSSAsPennsylvania System of School Assessment
The Pennsylvania System of School Assessment is a standardized test administered to public schools in the state of Pennsylvania. Students in grades 3, 4, 5, 6, 7, 8, and 11 are assessed in reading skills and mathematics. Students in grades 5, 8, and 11 are assessed in writing skills...
results in reading, writing, math and three years of science.
- 2010 - 487th
- 2009 - 484th
- 2008 - 483rd
- 2007 - 484th out of 501 districts
In 2010, the School District of Lancaster was in Corrective Action II 2nd Year AYP status due to chronic low student achievement in reading and in mathematics. The district administration was mandated by the state to develop a school improvement plan that focused on raising students' achievement. Nine of the district's school were required to permit students to transfer within the district to an achieving school.
In 2009, the academic achievement of the students of the School District of Lancaster was in the bottom 2 percentile of Pennsylvania's 500 school districts. Scale (0-99; 100 is state best)
Graduation rate
In 2010, the Pennsylvania Department of EducationPennsylvania Department of Education
The Pennsylvania Department of Education is the executive department of the state charged with K-12 and adult educational budgeting, management and guidelines. As the state education agency, its activities are directed by Pennsylvania's Secretary of Education, Gerald L. Zahorchak...
issued a new, 4 year cohort graduation rate. School District of Lancaster's rate was 65% for 2010.
According to traditional graduation rate calculations:
- 2010 - 80%
- 2009 - 71%
- 2008 - 65%
- 2007 - 65%
- 2006 - 56%
High schools
The school district operates 2 high school buildings on a single campus. They are JP McCaskey High School and McCaskey East School. They have declined to Corrective Action II 4th Year in 2010 as a result of continuing very low achievement of its pupils. In school year 2009, they were in Corrective Action II 3rd Year due to chronic low achievement of the pupils. The school district was mandated to develop a school improvement plan to address the shortcomings, in the summer of 2009. The J. P. McCaskey High School Campus year consists of two semesters, four marking periods of nine weeks each. J.P. McCaskey High School Campus is structured by Small Learning Communities, for grades 9 – 12, with each community focusing on a set of related career pathways.
11th Grade Reading
- 2010 - 41% on grade level (38% below basic). In Pennsylvania, 66% of 11th graders are on grade level.
- 2009 - 35% (42% below basic), State - 65%
- 2008 - 38% (43% below basic), State - 65%
- 2007 - 44% (37% below basic), State - 65%
- 2006 - 44%
11th Grade Math:
- 2010 - 32%, on grade level (48% below basic). State - 59%
- 2009 - 25% (53% below basic). State - 56%.
- 2008 - 33% (43% below basic), State - 56%
- 2007 - 39% (39% below basic), State - 53%
- 2006 - 33.1%
11th Grade Science:
- 2010 - 10% on grade level (52% below basic). State - 39%
- 2009 - 13% (53% below basic). State - 40%
- 2008 - 11% (53% below basic). State - 39%
Dual enrollment
The high school offers a Dual EnrollmentDual enrollment
In education, dual enrollment involved students being enrolled in two separate, academically related institutions. It may also refer to any individual who is participating in two related programs, but such a general form of usage is uncommon....
program. This state program permits high school students to take courses, at local higher education institutions, to earn college credits. Students remain enrolled at their high school. The courses count towards both high school graduation requirements and towards earning a college degree. The students continue to have full access to activities at their high school. The college
College
A college is an educational institution or a constituent part of an educational institution. Usage varies in English-speaking nations...
credits are offered at a deeply discounted rate. The state offers a small grant to assist students in costs for tuition, fees and books. Under the Pennsylvania Transfer and Articulation Agreement, many Pennsylvania colleges and universities accept these credits for students who transfer to their institutions. The Pennsylvania College Credit Transfer System reported in 2009, that students saved nearly $35.4 million by having their transferred credits count towards a degree under the new system.
For the 2009-10 funding year, the school district received a state grant of $43,304 for the program.
Graduation requirements
The School District of Lancaster School Board has determined that a high school student must earn 24.2 credits in order to graduate, including: English 4 credits, Social StudiesSocial studies
Social studies is the "integrated study of the social sciences and humanities to promote civic competence," as defined by the American National Council for the Social Studies...
3 credits, Mathematics 4 credits, Science 3 credits, Physical Education 2 credits, Art or Music 0.5 credit, World Language 2 credits and 5.5 elective credits.
By law, all Pennsylvania secondary school students must complete a project as a part of their eligibility to graduate from high school. The type of project, its rigor and its expectations are set by the individual school district.
By Pennsylvania School Board regulations, for the graduating classes of 2016, students must demonstrate successful completion of secondary level course work in Algebra I, Biology
Biology
Biology is a natural science concerned with the study of life and living organisms, including their structure, function, growth, origin, evolution, distribution, and taxonomy. Biology is a vast subject containing many subdivisions, topics, and disciplines...
, English Composition, and Literature
Literature
Literature is the art of written works, and is not bound to published sources...
for which the Keystone Exams serve as the final course exams. Students’ Keystone Exam scores count for at least one-third of the final course grade.
International baccalaureate program
McCaskey High School participates in the International Baccalaureate Program since July 1997. The PreIB curriculum offers honors level courses in grades 9 and 10 as preparation for the IB courses. The International Baccalaureate Program is a very rigorous, preuniversity two year curriculum offered to students during grades 11 and 12. Students who fulfill the academic and community service requirements and obtain at least 24 of the 45 points on the required exams receive a diploma from the International Baccalaureate in addition to their McCaskey Diploma. The first students who received an IB Diploma graduated in June, 2000.College Remediation
According to a Pennsylvania Department of EducationPennsylvania Department of Education
The Pennsylvania Department of Education is the executive department of the state charged with K-12 and adult educational budgeting, management and guidelines. As the state education agency, its activities are directed by Pennsylvania's Secretary of Education, Gerald L. Zahorchak...
study released in January 2009, 52% of Lancaster High School graduates required remediation in mathematics and or reading before they were prepared to take college level courses in the Pennsylvania State System of Higher Education
Pennsylvania State System of Higher Education
The Pennsylvania State System of Higher Education is the largest provider of higher education in the Commonwealth of Pennsylvania and a large public university system in the United States. It is the tenth-largest university system in the United States and 43rd largest in the world...
or community colleges. Less than 66% of Pennsylvania high school graduates, who enroll in a four-year college in Pennsylvania, will earn a bachelor's degree within six years. Among Pennsylvania high school graduates pursuing an associate degree, only one in three graduate in three years. Per the Pennsylvania Department of Education
Pennsylvania Department of Education
The Pennsylvania Department of Education is the executive department of the state charged with K-12 and adult educational budgeting, management and guidelines. As the state education agency, its activities are directed by Pennsylvania's Secretary of Education, Gerald L. Zahorchak...
, one in three recent high school graduates who attend Pennsylvania's public universities and community colleges takes at least one remedial course in math, reading or English.
Hand Middle School
In 2010 the school declined to Corrective Action II 4th Year AYP status due to chronically low student achievement. In 2009, the school was in Corrective Action II 3rd Year due to chronically low student achievement. The attendance rate was 93% in both 2009 and 2010. Hand MIddle School serves grades 6th - 8th.PSSA Results:
8th Grade Reading
- 2010 - 45% on grade level (33% below basic). In Pennsylvania, 81% of 8th graders on grade level.
- 2009 - 51% (30% below basic), State - 80%
- 2008 - 56% (22% below basic), State - 78%
- 2007 - 39% (34% below basic), State - 75%
8th Grade Math:
- 2010 - 44% on grade level (36% below basic). State - 75%
- 2009 - 38% (30% below basic), State - 71%
- 2008 - 60% (28% below basic), State - 70%
- 2007 - 44% (35% below basic), State - 68%
8th Grade Science:
- 2010 - 15% on grade level (73% below basic). State - 57%
- 2009 - 12% (66% below basic), State - 55%
- 2008 - 18%, State - 52%
7th Grade Reading
- 2010 - 38% on grade level (34% below basic). State - 73%
- 2009 - 38% (30% below basic), State - 71%
- 2008 - 42% (30.8% below basic), State - 70%
- 2007 - 49% (31% below basic), State - 67%
7th Grade Math:
- 2010 - 43% on grade level (41% below basic). State - 77%
- 2009 - 48% (29% below basic), State - 75%
- 2008 - 54% (24% below basic), State - 71%
- 2007 - 52% (28% below basic), State - 67%
6th Grade Reading:
- 2010 - 36% on grade level (45% below basic). State - 68%
- 2009 - 36% (42% below basic), State - 67%
- 2008 - 34% (39% below basic), State - 67%
- 2007 - 47% (25% below basic), State - 63%
6th Grade Math:
- 2010 - 45% on grade level (32% below basic). State - 78%
- 2009 - 46% (31% below basic), State - 75%
- 2008 - 42% (37% below basic), State - 72%
- 2007 - 39% (38% below basic), State - 69%
- 2006 - Attendance at Hand Middle School in Lancaster, Pennsylvania during the 2005-2006 school year was 89.52%, barely better than the 89.00% scored in the prior year. Students were 38.4% proficient in math, 35.8% proficient in reading.
Lincoln Middle School
The school declined to School Improvement II AYP status due to ongoing low student achievement. In 2009 the school was in Making Progress: in School Improvement I AYP status. The attendance rate was 92% in both 2009 and 2010. Lincoln Middle School serves grades 6th - 8th.PSSA Results:
8th Grade Reading
- 2010 - 62% on grade level (18% below basic). In Pennsylvania, 81% of 8th graders on grade level.
- 2009 - 59% (20% below basic), State - 80%
- 2008 - 51% (28% below basic), State - 78%
- 2007 - 49% (25% below basic), State - 75%
8th Grade Math:
- 2010 - 59% on grade level (25% below basic). State - 75%
- 2009 - 53% (17% below basic), State - 71%
- 2008 - 46% (31% below basic), State - 70%
- 2007 - 51% (22% below basic), State - 68%
8th Grade Science:
- 2010 - 20% on grade level (60% below basic). State - 57%
- 2009 - 19% (56% below basic), State - 55%
- 2008 - 15%, State - 52%
7th Grade Reading
- 2010 - 42% on grade level (31% below basic). State - 73%
- 2009 - 44% (25% below basic), State - 71%
- 2008 - 42% (34% below basic), State - 70%
- 2007 - 37% (36% below basic), State - 67%
7th Grade Math:
- 2010 - 44% on grade level (30% below basic). State - 77%
- 2009 - 52% (27% below basic), State - 75%
- 2008 - 43% (36% below basic), State - 71%
- 2007 - 42% (36% below basic), State - 67%
6th Grade Reading:
- 2010 - 47% on grade level (29% below basic). State - 68%
- 2009 - 36% (34% below basic), State - 67%
- 2008 - 38% (30% below basic), State - 67%
- 2007 - 41% (34% below basic), State - 63%
6th Grade Math:
- 2010 - 64% on grade level (17% below basic). State - 78%
- 2009 - 64% (15% below basic), State - 75%
- 2008 - 58% (22% below basic), State - 72%
- 2007 - 52% (29% below basic), State - 69%
Attendance at Lincoln Middle School in Lancaster, Pennsylvania during the 2005-2006 school year was 91.82%, essentially the same as the 91.65% scored in the prior year. When reported school wide, students were 49.0% proficient in math, 51.5% proficient in reading.
Reynolds Middle School
In 2010, Reynolds Middle School declined to Corrective Action II 4th Year AYP status due to chronic low student achievement. In 2009 the school was in Corrective Action II 3rd Year AYP status.‘’’PSSA Results:’’’
8th Grade Reading
- 2010 - 55% on grade level (31% below basic). State - 81%
- 2009 - 59% (22% below basic), State - 80%
- 2008 - 55% (27% below basic), State - 78%
- 2007 - 57% (27% below basic), State - 75%
8th Grade Math:
- 2010 - 43% on grade level (35% below basic). State - 75%
- 2009 - 45% (27% below basic), State - 71%
- 2008 - 51% (28% below basic), State - 70%
- 2007 - 49% (28% below basic), State - 68%
8th Grade Science:
- 2010 - 22% on grade level (66% below basic). State - 57%
- 2009 - 26% (51% below basic), State - 55%
- 2008 - 18%, State - 52%
7th Grade Reading
- 2010 - 46% on grade level (31% below basic). State - 73%
- 2009 - 41% (34% below basic), State - 71%
- 2008 - 50% (25% below basic), State - 70%
- 2007 - 50% (29% below basic), State - 67%
7th Grade Math:
- 2010 - 51% on grade level (28% below basic). State - 77%
- 2009 - 49% (32% below basic), State - 75%
- 2008 - 56% (25% below basic), State - 71%
- 2007 - 50% (30% below basic), State - 67%
6th Grade Reading:
- 2010 - 44% on grade level (42% below basic). State - 68%
- 2009 - 38% (36% below basic), State - 67%
- 2008 - 28% (43% below basic), State - 67%
- 2007 - 44% (28% below basic), State - 63%
6th Grade Math:
- 2010 - 51% on grade level (32% below basic). State - 78%
- 2009 - 49% (28% below basic), State - 75%
- 2008 - 44% (38% below basic), State - 72%
- 2007 - 57% (27% below basic), State - 69%
Attendance at Reynolds Middle School in Lancaster, Pennsylvania during the 2005-2006 school year was 89.54%, an improvement from the 88.57% scored in the prior year. Students were 56.3% proficient in math, 52.8% proficient in reading.
Wheatland Middle School
In 2010, Wheatland Middle School declined to Corrective Action II 2nd Year AYP status due to chronic low student achievement. In 2009 the school was in Corrective Action II 1st Year AYP status. The attendance rate was 95% in 2010 and 94% in 2009‘’’PSSA Results:’’’
8th Grade Reading
- 2010 - 67% on grade level (19% below basic). State - 81%
- 2009 - 63% (18% below basic), State - 80%
- 2008 - 54% (28% below basic), State - 78%
- 2007 - 61% (17% below basic), State - 75%
8th Grade Math:
- 2010 - 46% on grade level (36% below basic). State - 75%
- 2009 - 48% (30% below basic), State - 71%
- 2008 - 52% (31% below basic), State - 70%
- 2007 - 62% (16% below basic), State - 68%
8th Grade Science:
- 2010 - 32% on grade level (44% below basic). State - 57%
- 2009 - 25% (48% below basic), State - 55%
- 2008 - 23% (49% below basic), State - 52%
7th Grade Reading
- 2010 - 50% on grade level (24% below basic). In Pennsylvania, 73% of 7th graders on grade level.
- 2009 - 46% (25% below basic), State - 71%
- 2008 - 52% (26% below basic), State - 70%
- 2007 - 50% (22% below basic), State - 67%
7th Grade Math:
- 2010 - 53% on grade level (33% below basic). State - 77%
- 2009 - 46% (31% below basic), State - 75%
- 2008 - 51% (28% below basic), State - 71%
- 2007 - 54% (27% below basic), State - 67%
6th Grade Reading:
- 2010 - 33% on grade level (43% below basic). State - 68%
- 2009 - 51% (26% below basic), State - 67%
- 2008 - 46% (24% below basic), State - 67%
- 2007 - 47% (32% below basic), State - 63%
6th Grade Math:
- 2010 - 46% on grade level (30% below basic). State -78%
- 2009 - 59% (22% below basic), State - 75%
- 2008 - 62% (21% below basic), State - 72%
- 2007 - 56% (25% below basic), State - 69%
Attendance at Wheatland Middle School in Lancaster, Pennsylvania during the 2005-2006 school year was 91.82%, essentially the same as the 91.21% scored in the prior year. Students were 42.3% proficient in math, 57.0% proficient in reading.
Buehrle Alternative School
Serves grades 6th through 11th. Provides a program for students who do not do well in the traditional classroom setting due to serious behavioral problems. Students undergo an academic evaluation at the start of each school year. Students follow an individualized academic and behavioral improvement plan prepared by the staff. The school uses small class sizes and intensive remediation to improve student achievement with the goal to have students earn a high school diploma. In 2010, nearly 90 students were attending the school.In 2011, the district contracted with a private company (Camelot Schools LLC ) to run the school for 3 years at a cost of $4.45 million. An application, by Camelot Schools, LLC to convert the school to a charter school and combine it with the district's Phoenix Academy, was rejected by the school board in Spring 2011.
Attendance at the Buehrle Alternative School in Lancaster, Pennsylvania during the 2005-2006 school year was 80.72%. This was their first year of operation for Buehrle. Students are referred to Buehrle after discipline and programs have been exhausted. Students were 13.5% proficient in math, 14.3% proficient in reading.
Elementary Schools
Attendance at Burrowes Elementary School in Lancaster, PennsylvaniaLancaster, Pennsylvania
Lancaster is a city in the south-central part of the Commonwealth of Pennsylvania. It is the county seat of Lancaster County and one of the older inland cities in the United States, . With a population of 59,322, it ranks eighth in population among Pennsylvania's cities...
during the 2005-2006 school year was 94.15%, essentially the same as the 94.46% scored in the prior year. Students were 56.0% proficient in math, 37.7% proficient in reading.
Attendance at Carter Macrae Elementary School in Lancaster, Pennsylvania during the 2005-2006 school year was 93.22%, essentially the same as the 93.27% scored in the prior year. Students were 56.3% proficient in math, 35.0% proficient in reading.
Attendance at Elizabeth R Martin Elementary School in Lancaster, Pennsylvania during the 2005-2006 school year was 96.17%, up from the 94.33% scored in the prior year. Students were 71.2% proficient in math, 57.5% proficient in reading.
Attendance at Fulton Elementary School in Lancaster, Pennsylvania during the 2005-2006 school year was 93.54%, slightly lower than the 94.52% scored in the prior year. Students were 59.2% proficient in math, 45.5% proficient in reading.
Attendance at George Washington Elementary School in Lancaster, Pennsylvania during the 2005-2006 school year was 93.33%, slightly higher than the 93.06% scored in the prior year. Students were 55.7% proficient in math, 40.8% proficient in reading.
Attendance at Hamilton Elementary School in Lancaster, Pennsylvania during the 2005-2006 school year was 95.00%, essentially the same as the 95.22% scored in the prior year. Students were 58.8% proficient in math, 41.9% proficient in reading.
Attendance at James Buchanan Elementary School in Lancaster, Pennsylvania during the 2005-2006 school year was 95.14%, slightly higher than the 94.89% scored in the prior year. Students were 77.8% proficient in math, 68.4% proficient in reading.
Attendance at King Elementary School in Lancaster, Pennsylvania during the 2005-2006 school year was 94.54%, slightly higher than the 94.14% scored in the prior year. Students were 49.8% proficient in math, 33.1% proficient in reading.
Attendance at Lafayette Elementary School in Lancaster, Pennsylvania during the 2005-2006 school year was 95.60%, essentially the same as the 94.15% scored in the prior year. Students were 57.0% proficient in math, 77.2% proficient in reading.
Attendance at Price Elementary School in Lancaster, Pennsylvania during the 2005-2006 school year was 93.99%, essentially the same as the 93.97% scored in the prior year. Students were 56.4% proficient in math, 42.2% proficient in reading.
Attendance at Ross Elementary School in Lancaster, Pennsylvania during the 2005-2006 school year was 95.03%, essentially the same as the 94.88% scored in the prior year. Students were 57.9% proficient in math, 46.4% proficient in reading.
Attendance at Thomas Wharton Elementary School in Lancaster, Pennsylvania during the 2005-2006 school year was 95.58%, slightly higher than the 94.58% scored in the prior year. Students were 70.1% proficient in math, 68.7% proficient in reading.
Attendance at Wickersham Elementary School in Lancaster, Pennsylvania during the 2005-2006 school year was 94.44%, essentially the same as the 94.37% scored in the prior year. Students were 69.7% proficient in math, 50.4% proficient in reading.
Special Education
In December 2009, the district administration reported that 2060 pupils or 18.3% of the district's pupils received Special EducationSpecial education
Special education is the education of students with special needs in a way that addresses the students' individual differences and needs. Ideally, this process involves the individually planned and systematically monitored arrangement of teaching procedures, adapted equipment and materials,...
services.
In order to comply with state and federal laws, the school district engages in identification procedures to ensure that eligible students receive an appropriate educational program consisting of special education and related services, individualized to meet student needs. At no cost to the parents, these services are provided in compliance with state and federal law; and are reasonably calculated to yield meaningful educational benefit and student progress. To identify students who may be eligible for special education, various screening activities are conducted on an ongoing basis. These screening activities include: review of group-based data (cumulative records, enrollment records, health records, report cards, ability and achievement test scores); hearing, vision, motor, and speech/language screening; and review by the Special Education administration. When screening results suggest that the student may be eligible, the District seeks parental consent to conduct a multidisciplinary evaluation. Parents who suspect their child is eligible may verbally request a multidisciplinary evaluation from a professional employee of the District or contact the Special Education Coordinator.
In 2010, the state of Pennsylvania provided $1,026,815,000 for Special Education services. The funds were distributed to districts based on a state policy which estimates that 16% of the district's pupils are receiving special education services. This funding is in addition to the state's basic education per pupil funding, as well as, all other state and federal funding.
School District of Lancaster received a $8,715,043 supplement for special education services in 2010.
For the 2011-12 school year, all Pennsylvania public school districts received the same level of funding for special education that they received in 2010. This level funding is provided regardless of changes in the number of pupils who need special education services and regardless of the level of services the respective students required.
Gifted Education
The District Administration reported that 285 or 2.40% of its students were gifted in 2009. By law, the district must provide mentally gifted programs at all grade levels. The referral process for a gifted evaluation can be initiated by teachers or parents by contacting the student’s building principal and requesting an evaluation. All requests must be made in writing. To be eligible for mentally gifted programs in Pennsylvania, a student must have a cognitive ability of at least 130 as measured on a standardized ability test by a certified school psychologist. Other factors that indicate giftedness will also be considered for eligibility.School safety and bullying
In 2010, the administration reported there were 73 reported episodes of bullying in the district. Although there were 77 incidents of assault on students, no students was placed in Alternative Education. The district reports also there were 216 incidents of fighting, 18 sexual assaults and 101 cases of harassment or intimidation.All Pennsylvania schools are required to have an anti-bullying policy incorporated into their Code of Student Conduct. The policy must identify disciplinary actions for bullying and designate a school staff person to receive complaints of bullying. The policy must be available on the school's website and posted in every classroom. School District of lancaster has posted its antibullying and cyberbullying policy in its website All Pennsylvania public schools must provide a copy of its anti-bullying policy to the Office for Safe Schools every year, and shall review their policy every three years. Additionally, the district must conduct an annual review of that policy with students. The Center for Schools and Communities works in partnership with the Pennsylvania Commission on Crime & Delinquency and the Pennsylvania Department of Education to assist schools and communities as they research, select and implement bullying prevention programs and initiatives.
Education standards relating to student safety and antiharassment programs are described in the 10.3. Safety and Injury Prevention in the Pennsylvania Academic Standards for Health, Safety and Physical Education.
Failing schools
Of the 117 schools in Lancaster County, Pennsylvania, only 13 failed to reach all their Adequate Yearly Progress goals, and six of them were in the School District of Lancaster.King Elementary School achieved only 12 of their 17 AYP goals. Their failures:
- 33.1% reading proficiency overall
- 33.5% reading proficiency among Latino/Hispanic students
- 16.7% reading proficiency among those with limited English proficiency
- 32.6% reading proficiency among the economically disadvantaged
- 32.9% math proficiency among those with limited English proficiency
Price Elementary School achieved only 12 of their 13 AYP goals. Their failures:
- 42.2% reading proficiency overall
Burrowes School achieved only 10 of their 13 AYP goals. Their failures:
- 37.7% reading proficiency overall
- 31.5% reading proficiency among Latino/Hispanic students
- 33.1% reading proficiency among the economically disadvantaged
Wheatland Middle School achieved only 21 of their 23 AYP goals. Their failures:
- 31.3% math proficiency among African American students
- 29.2% math proficiency among the economically disadvantaged
The McCaskey campuses achieved only 26 of their 29 AYP goals. Their failures:
- 56.83% graduation rate overall
- 20.1% math proficiency among Latino/Hispanic students
- 7.1% math proficiency among IEP/Special Education students
The Buehrle Alternative school achieved 3 of their 9 AYP goals. Their failures:
- 86.4% participation in reading proficiency test overall
- 88.3% participation in math proficiency test overall
- 84.0% participation in reading proficiency test among Latino/Hispanic students
- 84.0% participation in math proficiency test among Latino/Hispanic students
- 89.3% participation in reading proficiency test among the economically disadvantaged
- 89.3% participation in math proficiency test among the economically disadvantaged