

Scaleogram
Encyclopedia
Signal processing
Signal processing is an area of systems engineering, electrical engineering and applied mathematics that deals with operations on or analysis of signals, in either discrete or continuous time...
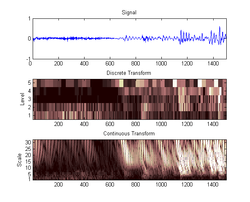
, a scaleogram or scalogram is a visual method of displaying a wavelet transform. There are 3 axes: x representing time
Time
Time is a part of the measuring system used to sequence events, to compare the durations of events and the intervals between them, and to quantify rates of change such as the motions of objects....
, y representing scale
Scale (ratio)
The scale ratio of some sort of model which represents an original proportionally is the ratio of a linear dimension of the model to the same dimension of the original. Examples include a 3-dimensional scale model of a building or the scale drawings of the elevations or plans of a building. In such...
, and z representing coefficient value. The z axis is often shown by varying the colour or brightness
Brightness
Brightness is an attribute of visual perception in which a source appears to be radiating or reflecting light. In other words, brightness is the perception elicited by the luminance of a visual target...
.
A scaleogram is the equivalent of a spectrogram
Spectrogram
A spectrogram is a time-varying spectral representation that shows how the spectral density of a signal varies with time. Also known as spectral waterfalls, sonograms, voiceprints, or voicegrams, spectrograms are used to identify phonetic sounds, to analyse the cries of animals; they were also...
for wavelets.