
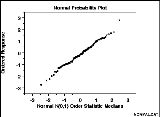
Normal probability plot
Encyclopedia
The normal probability plot is a graphical technique for normality test
ing: assessing whether or not a data set
is approximately normally distributed.
The data are plotted against a theoretical normal distribution in such a way that the points should form an approximate straight line. Departures from this straight line indicate departures from normality.
The normal probability plot is a special case of the probability plot
, for the case of a normal distribution.
These are calculated according to the following formula. For each data value , find
  such that:
That is, the observations are plotted as a function of the corresponding normal order statistic medians.
Another way to think about this is that the sample values are plotted against what we would expect to see if it was strictly consistent with the normal distribution.
If the data is consistent with a sample from a normal distribution the points should lie close to a straight line. As a reference, a straight line can be fit to the points. The further the points vary from this line, the greater the indication of departure from normality. If the sample has mean 0, standard deviation 1 then a line through 0 with slope 1 could be used. How close to the line the points will lie does depend on the sample size. For a large sample, > 100, we'd expect the points to be very close to the reference line. Smaller samples will see a much larger variation, but might still be consistent with a normal sample.
One advantage of this method of computing probability plots is that the intercept
and slope
estimates of the fitted line are in fact estimates for the location
and scale parameter
s of the distribution. Although this is not too important for the normal distribution since the location and scale are estimated by the mean and standard deviation, respectively, it can be useful for many other distributions.
The correlation coefficient of the points on the normal probability plot can be compared to a table of critical values to provide a formal test of the hypothesis that the data come from a normal distribution.
This is a sample of size 50 from a right-skewed distribution, plotted as both a histogram, and a normal probability plot.
This is a sample of size 50 from a uniform distribution, plotted as both a histogram, and a normal probability plot.
Normality test
In statistics, normality tests are used to determine whether a data set is well-modeled by a normal distribution or not, or to compute how likely an underlying random variable is to be normally distributed....
ing: assessing whether or not a data set
Data set
A data set is a collection of data, usually presented in tabular form. Each column represents a particular variable. Each row corresponds to a given member of the data set in question. Its values for each of the variables, such as height and weight of an object or values of random numbers. Each...
is approximately normally distributed.
The data are plotted against a theoretical normal distribution in such a way that the points should form an approximate straight line. Departures from this straight line indicate departures from normality.
The normal probability plot is a special case of the probability plot
Probability plot
In statistics, a P-P plot is a probability plot for assessing how closely two data sets agree, which plots the two cumulative distribution functions against each other....
, for the case of a normal distribution.
Definition
The normal probability plot is formed by:- Vertical axis: Ordered response values
- Horizontal axis: Normal order statisticOrder statisticIn statistics, the kth order statistic of a statistical sample is equal to its kth-smallest value. Together with rank statistics, order statistics are among the most fundamental tools in non-parametric statistics and inference....
medianMedianIn probability theory and statistics, a median is described as the numerical value separating the higher half of a sample, a population, or a probability distribution, from the lower half. The median of a finite list of numbers can be found by arranging all the observations from lowest value to...
s or means; see rankitRankitIn statistics, rankits of a set of data are the expected values of the order statistics of a sample from the standard normal distribution the same size as the data. They are primarily used in the normal probability plot, a graphical technique for normality testing.-Example:This is perhaps most...
These are calculated according to the following formula. For each data value
, find such that:That is, the observations are plotted as a function of the corresponding normal order statistic medians.
Another way to think about this is that the sample values are plotted against what we would expect to see if it was strictly consistent with the normal distribution.
If the data is consistent with a sample from a normal distribution the points should lie close to a straight line. As a reference, a straight line can be fit to the points. The further the points vary from this line, the greater the indication of departure from normality. If the sample has mean 0, standard deviation 1 then a line through 0 with slope 1 could be used. How close to the line the points will lie does depend on the sample size. For a large sample, > 100, we'd expect the points to be very close to the reference line. Smaller samples will see a much larger variation, but might still be consistent with a normal sample.
Other distributions
Probability plots for distributions other than the normal are computed in exactly the same way. The normal quantile function G is simply replaced by the quantile function of the desired distribution. That is, a probability plot can easily be generated for any distribution for which one has the quantile function.One advantage of this method of computing probability plots is that the intercept
Intercept
Intercept may refer to:*X-intercept, the point where a line crosses the x-axis*Y-intercept, the point where a line crosses the y-axis*Interception *The Mona Intercept, a 1980 thriller novel by Donald Hamilton...
and slope
Slope
In mathematics, the slope or gradient of a line describes its steepness, incline, or grade. A higher slope value indicates a steeper incline....
estimates of the fitted line are in fact estimates for the location
Location parameter
In statistics, a location family is a class of probability distributions that is parametrized by a scalar- or vector-valued parameter μ, which determines the "location" or shift of the distribution...
and scale parameter
Scale parameter
In probability theory and statistics, a scale parameter is a special kind of numerical parameter of a parametric family of probability distributions...
s of the distribution. Although this is not too important for the normal distribution since the location and scale are estimated by the mean and standard deviation, respectively, it can be useful for many other distributions.
The correlation coefficient of the points on the normal probability plot can be compared to a table of critical values to provide a formal test of the hypothesis that the data come from a normal distribution.
Examples
This is a sample of size 50 from a normal distribution, plotted as both a histogram, and a normal probability plot.This is a sample of size 50 from a right-skewed distribution, plotted as both a histogram, and a normal probability plot.
This is a sample of size 50 from a uniform distribution, plotted as both a histogram, and a normal probability plot.