

List of countries by current account balance
Encyclopedia
Current account
In economics, the current account is one of the two primary components of the balance of payments, the other being the capital account. The current account is the sum of the balance of trade , net factor income and net transfer payments .The current account balance is one of two major...
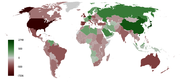
(CAB), based on data from 2010 (with some exceptions), as listed in the CIA World Factbook.
| Rank | Country | CAB (billion US dollars) | Year |
|---|---|---|---|
| 1 | 305.400 | 2010 | |
| 2 | 188.400 | 2010 | |
| 3 | 166.500 | 2010 | |
| 4 | 71.130 | 2010 | |
| 5 | 60.230 | 2010 | |
| 6 | 52.030 | 2010 | |
| 7 | 49.350 | 2010 | |
| 8 | 46.690 | 2010 | |
| 9 | 44.080 | 2010 | |
| 10 | (Taiwan) | 39.000 | 2010 |
| 11 | 38.200 | 2010 | |
| 12 | 36.350 | 2010 | |
| 13 | 34.140 | 2010 | |
| 14 | 27.770 | 2010 | |
| 15 | 22.070 | 2010 | |
| 16 | 21.680 | 2010 | |
| 17 | 20.110 | 2010 | |
| 18 | 18.070 | 2010 | |
| 19 | 15.960 | 2010 | |
| 20 | 15.530 | 2010 | |
| 21 | 14.350 | 2010 | |
| 22 | 12.290 | 2010 | |
| 23 | 9.900 | 2010 | |
| 24 | 9.760 | 2010 | |
| 25 | 9.510 | 2010 | |
| 26 | 8.532 | 2010 | |
| 27 | 7.024 | 2008 | |
| 28 | 6.993 | 2010 | |
| 29 | 6.976 | 2010 | |
| 30 | 6.269 | 2010 | |
| 31 | 6.230 | 2010 | |
| 32 | 5.588 | 2010 | |
| 33 | 4.696 | 2010 | |
| 34 | 3.959 | 2010 | |
| 35 | 3.734 | 2010 | |
| 36 | 3.409 | 2010 | |
| 37 | 3.396 | 2010 | |
| 38 | 3.363 | 2010 | |
| 39 | 3.081 | 2010 | |
| 40 | 2.724 | 2010 | |
| 41 | 2.715 | 2010 | |
| 42 | 2.089 | 2010 | |
| 43 | 1.620 | 2010 | |
| 44 | 1.231 | 2010 | |
| 45 | 1.161 | 2007 | |
| 46 | 1.033 | 2010 | |
| 47 | 0.690 | 2010 | |
| 48 | 0.652 | 2010 | |
| 49 | 0.649 | 2010 | |
| 50 | 0.603 | 2010 | |
| 51 | 0.591 | 2010 | |
| 52 | 0.589 | 2010 | |
| 53 | 0.534 | 2010 | |
| 54 | 0.270 | 2010 | |
| 55 | 0.265 | 2010 | |
| 56 | 0.164 | 2008 | |
| 57 |  British Virgin Islands British Virgin Islands |
0.134 | 1999 |
| 58 |  Cook Islands Cook Islands |
0.026 | 2005 |
| 59 | 0.024 | 2007 | |
| 60 |  Palau Palau |
0.015 | FY03/04 |
| 61 | 0.008 | 2007 | |
| 62 | –0.006 | 2007 | |
| 63 |  Tuvalu Tuvalu |
–0.011 | 2003 |
| 64 | –0.012 | 2010 | |
| 65 | –0.021 | 2007 | |
| 66 | –0.023 | 2007 | |
| 67 | –0.024 | 2007 | |
| 68 |  Federated States of Micronesia Federated States of Micronesia |
||
| FY05 | |||
| 69 | –0.042 | 2010 | |
| 70 |  Anguilla Anguilla |
||
| 2003 | |||
| 71 | –0.060 | 2007 | |
| 72 | –0.063 | 2007 | |
| 73 | –0.072 | 2007 | |
| 74 | –0.073 | 2010 | |
| 75 | –0.077 | 2007 | |
| 76 |  Cuba Cuba |
–0.087 | 2010 |
| 77 | –0.090 | 2010 | |
| 78 | –0.099 | 2010 | |
| 79 | –0.099 | 2010 | |
| 80 | –0.125 | 2010 | |
| 81 | –0.136 | 2010 | |
| 82 | –0.138 | 2007 | |
| 83 | –0.143 | 2007 | |
| 84 | –0.149 | 2007 | |
| 85 | –0.151 | 2010 | |
| 86 | –0.163 | 2007 | |
| 87 | –0.184 | 2007 | |
| 88 | –0.187 | 2010 | |
| 89 | –0.195 | 2010 | |
| 90 | –0.199 | 2007 | |
| 91 | –0.210 | 2010 | |
| 92 | –0.211 | 2007 | |
| 93 | –0.212 | 2010 | |
| 94 | –0.224 | 2007 | |
| 95 | –0.254 | 2007 | |
| 96 | –0.283 | 2009 | |
| 97 | –0.286 | 2010 | |
| 98 | –0.311 | 2010 | |
| 99 | –0.315 | 2010 | |
| 100 | –0.321 | 2007 | |
| 101 | –0.328 | 2010 | |
| 102 | –0.330 | 2010 | |
| 103 | –0.333 | 2010 | |
| 104 | –0.339 | 2010 | |
| 105 | –0.351 | 2010 | |
| 106 | –0.352 | 2009 | |
| 107 | –0.374 | 2010 | |
| 108 | –0.377 | 2010 | |
| 109 | –0.378 | 2010 | |
| 110 | –0.391 | 2010 | |
| 111 | –0.403 | 2010 | |
| 112 | –0.434 | 2010 | |
| 113 | –0.446 | 2007 | |
| 114 | –0.449 | 2010 | |
| 115 | –0.463 | 2010 | |
| 116 | –0.486 | 2010 | |
| 117 | –0.489 | 2010 | |
| 118 | –0.507 | 2007 | |
| 119 | –0.552 | 2010 | |
| 120 | –0.565 | 2010 | |
| 121 | –0.569 | 2010 | |
| 122 | –0.582 | 2010 | |
| 123 | –0.598 | 2010 | |
| 124 | –0.600 | 2010 | |
| 125 | –0.692 | 2010 | |
| 126 | –0.781 | 2010 | |
| 127 | –0.784 | 2010 | |
| 128 | –0.819 | 2010 | |
| 129 | –0.826 | 2010 | |
| 130 | –0.907 | 2010 | |
| 131 | –0.918 | 2010 | |
| 132 | –0.949 | 2010 | |
| 133 | –0.975 | 2010 | |
| 134 | –1.028 | 2010 | |
| 135 | –1.046 | 2010 | |
| 136 | –1.046 | 2010 | |
| 137 | –1.048 | 2010 | |
| 138 | –1.102 | 2007 | |
| 139 | –1.129 | 2010 | |
| 140 | –1.138 | 2010 | |
| 141 | –1.175 | 2010 | |
| 142 | –1.245 | 2010 | |
| 143 | –1.345 | 2010 | |
| 144 | –1.349 | 2010 | |
| 145 | –1.382 | 2010 | |
| 146 | –1.389 | 2010 | |
| 147 | –1.404 | 2010 | |
| 148 | –1.414 | 2010 | |
| 149 | –1.470 | 2010 | |
| 150 | –1.477 | 2010 | |
| 151 | –1.503 | 2010 | |
| 152 | –1.523 | 2010 | |
| 153 | –1.784 | 2010 | |
| 154 | –1.871 | 2010 | |
| 155 | –1.930 | 2010 | |
| 156 | –2.128 | 2010 | |
| 157 | –2.181 | 2010 | |
| 158 | –2.232 | 2010 | |
| 159 | –2.312 | 2010 | |
| 160 | –2.475 | 2009 | |
| 161 | –2.500 | 2010 | |
| 162 | –2.523 | 2010 | |
| 163 | –2.595 | 2010 | |
| 164 | –2.600 | 2010 | |
| 165 | –2.641 | 2010 | |
| 167 | –3.191 | 2010 | |
| 168 | –3.862 | 2010 | |
| 169 | –4.504 | 2010 | |
| 170 | –5.062 | 2010 | |
| 171 | –5.946 | 2010 | |
| 172 | –5.956 | 2010 | |
| 173 | –6.972 | 2010 | |
| 174 | –7.000 | 2010 | |
| 175 | –7.922 | 2010 | |
| 176 | –7.934 | 2010 | |
| 177 | –12.220 | 2010 | |
| 178 | –12.330 | 2010 | |
| 179 | –16.510 | 2010 | |
| 180 | –17.100 | 2010 | |
| 181 | –19.030 | 2010 | |
| 182 | –26.910 | 2010 | |
| 183 | –35.230 | 2010 | |
| 184 | –38.820 | 2010 | |
| 185 | –40.210 | 2010 | |
| 186 | –40.340 | 2010 | |
| 187 | –52.730 | 2010 | |
| 188 | –53.290 | 2010 | |
| 189 | –61.980 | 2010 | |
| 190 | –66.740 | 2010 | |
| 191 | –265.000 | 2010 | |
| 192 | –561.000 | 2010 | |
See also
- List of countries by public debt (as percentage of gross domestic product)
- List of countries by current account balance as a percentage of GDP
- List of countries by leading trade partners
- Balance of paymentsBalance of paymentsBalance of payments accounts are an accounting record of all monetary transactions between a country and the rest of the world.These transactions include payments for the country's exports and imports of goods, services, financial capital, and financial transfers...
- Balance of tradeBalance of tradeThe balance of trade is the difference between the monetary value of exports and imports of output in an economy over a certain period. It is the relationship between a nation's imports and exports...