
List of countries by English-speaking population
Encyclopedia
Country
A country is a region legally identified as a distinct entity in political geography. A country may be an independent sovereign state or one that is occupied by another state, as a non-sovereign or formerly sovereign political division, or a geographic region associated with a previously...
. This includes both native speaker
First language
A first language is the language a person has learned from birth or within the critical period, or that a person speaks the best and so is often the basis for sociolinguistic identity...
s and second-language
Second language
A second language or L2 is any language learned after the first language or mother tongue. Some languages, often called auxiliary languages, are used primarily as second languages or lingua francas ....
speakers of English
English language
English is a West Germanic language that arose in the Anglo-Saxon kingdoms of England and spread into what was to become south-east Scotland under the influence of the Anglian medieval kingdom of Northumbria...
.
Statistics on second language speakers are usually imprecise, in part because there is no widely agreed definition of second language speakers - there is no differentiation between countries where English is the lingua franca
Lingua franca
A lingua franca is a language systematically used to make communication possible between people not sharing a mother tongue, in particular when it is a third language, distinct from both mother tongues.-Characteristics:"Lingua franca" is a functionally defined term, independent of the linguistic...
and those where it is not.
Moreover, some numbers have been calculated by Wikipedia editors from data in other sources, so these figures are imprecise and should be treated with great caution.
The degree of caution needed can be put into perspective by noting that the English-language newspaper with the highest daily circulation is the Times of India (3.24 million) even though India only has a quarter of a million people who use English as a mother tongue.
List in order of total speakers
| Rank | Country | % English speakers | Eligible population | Total English speakers | As first language | As an additional language | | Comment |
|---|---|---|---|---|---|---|---|
| 1 |  United States United States |
% | 280,950,438 | 267,444,149 | 225,505,953 | 41,938,196 | Figures are from the year 2007 American Community Survey American Community Survey The American Community Survey is an ongoing statistical survey by the U.S. Census Bureau, sent to approximately 250,000 addresses monthly . It regularly gathers information previously contained only in the long form of the decennial census... by the U.S. Census Bureau. English speaker figures are for persons age 5 and older. Total population age 5 and older was 280,950,438 of which 267,444,149 stated that they spoke English "very well" or "well". Second language speakers are respondents age 5 and older who reported they do not speak English at home but know it "very well" or "well". |
| 2 |  India India |
% | 1,100,000,000 | 125,226,449 | 226,449 (2001 estimate) | 125,000,000 |
2001 figures for native language. The figures include English speakers, but not English users. |
| 3 |  Philippines Philippines |
% | 97,000,000 | 89,800,000 | 3,427,000 | >46,373,000 | Total speakers: Census 2000, text above Figure 7. 63.71% of the 66.7 million people aged 5 years or more could speak English. Native speakers: Census 1995, as quoted by Andrew Gonzalez in The Language Planning Situation in the Philippines, Journal of Multilingual and Multicultural Development, 19 (5&6), 487–525. (1998). Ethnologue Ethnologue Ethnologue: Languages of the World is a web and print publication of SIL International , a Christian linguistic service organization, which studies lesser-known languages, to provide the speakers with Bibles in their native language and support their efforts in language development.The Ethnologue... lists 3.4 million native speakers with 75% of the population speaking it as an additional language. |
| 4 |  Nigeria Nigeria |
% | 148,093,000 | 79,000,000 | 4,000,000 | >75,000,000 | Figures are for speakers of Nigerian Pidgin Nigerian Pidgin Nigerian Pidgin is an English-based pidgin and a creole language spoken as a lingua franca across Nigeria. The language is commonly referred to as "Pidgin" or "Brokin". It is often not considered a creole language since most speakers are not native speakers, although many children do learn it early... , an English-based pidgin or creole. Ihemere gives a range of roughly 3 to 5 million native speakers; the midpoint of the range is used in the table. Ihemere, Kelechukwu Uchechukwu. 2006. "A Basic Description and Analytic Treatment of Noun Clauses in Nigerian Pidgin." Nordic Journal of African Studies 15(3): 296–313. |
| 5 |  United Kingdom United Kingdom |
% | 60,975,000 | 59,600,000 | 58,100,000 | 1,500,000 | Source: Crystal (2005), p. 109. |
| 6 |  Germany Germany |
56% | 82,191,000 | 46,272,504 | 272,504 | 46,000,000 | Native speakers: Statistisches Bundesamt (cited here). Non-native speakers: Eurobarometer report 2006 Does not include foreign military personnel based in Germany. |
| 7 |  Canada Canada |
% | 33,355,400 | 25,246,220 | 17,694,830 | 7,551,390 | Source: 2001 Census - Knowledge of Official Languages and Mother Tongue. The 2001 count noted that of 29,639,030 speakers, 20,014,645 spoke English only, and 5,231,575 spoke English and French, while 3,946,525 spoke French only and 446,920 who were classified as speaking "neither English nor French". No data was listed for persons who spoke English and a language other than French. The native speakers figure comprises 122,660 people with both French and English as a native language, plus 17,572,170 people with English and not French as a native language. |
| 8 |  Early Modern France Early Modern France |
36% | 64,473,140 | 23,000,000 | 23,000,000 | Source: Eurobarometer report 2006 | |
| 9 |  Pakistan Pakistan |
% | 164,157,000 | 18,000,000 | 18,000,000 | Source: | |
| 10 |  Australia Australia |
% | 21,394,309 | 17,357,833 | 15,013,965 | 2,343,868 | Source: 2001 Census. http://www.abs.gov.au/AUSSTATS/census1.nsf/log?openagent&Aust%5FProficiency%20in%20Spoken%20English%20Language%2Ezip&CC0&2001%20Census%20Classification%20Count&6BCA40CE3C9EC14DCA256C62001EAB3C&0&2001&19%2E11%2E2002&Current The 2001 census data is subject to multiple interpretations. The data noted that 18,972,350 persons out of 21,394,309 total were speakers of a language, and excluded young children. However, more than a million of those 18,972,350 persons provided no information; 879,778 did not give information on proficiency, and 203,101 were "overseas visitors" who were not asked. Of the 17,889,671 persons for whom an inquiry was made 17,357,833 spoke English only, or "well" or "very well" as a second language; while 531,838 spoke "not well" or "not at all". |
| 11 |  Italy Italy |
29% | 59,619,290 | 17,000,000 | 17,000,000 | Source: Eurobarometer report 2006 | |
| 12 |  Netherlands Netherlands |
87% | 16,445,000 | 14,000,000 | 14,000,000 | Source: Eurobarometer report 2006 | |
| 13 |  South Africa South Africa |
% | 47,850,700 | 13,673,203 | 3,673,203 | 10,000,000 | Native speakers: 2001 Census: Census in Brief, page 15 (Table 2.5) Non-native speakers: Crystal (2005), p. 109. |
| 14 |  Spain Spain |
27% | 46,063,000 | 12,500,000 | 12,500,000 | Source: Eurobarometer report 2006 | |
| 15 |  Turkey Turkey |
17% | 70,586,256 | 12,000,000 | 12,000,000 | Source: Eurobarometer report 2006 | |
| 16 |  Poland Poland |
29% | 38,115,967 | 11,000,000 | 11,000,000 | Source: Eurobarometer report 2006 | |
| 17 |  Mainland China Mainland China |
% | 1,200,000,000 | 10,000,000 | 10,000,000 | Figures are for English users in mainland China Mainland China Mainland China, the Chinese mainland or simply the mainland, is a geopolitical term that refers to the area under the jurisdiction of the People's Republic of China . According to the Taipei-based Mainland Affairs Council, the term excludes the PRC Special Administrative Regions of Hong Kong and... only (i.e. excluding Hong Kong where English is an official language Official language An official language is a language that is given a special legal status in a particular country, state, or other jurisdiction. Typically a nation's official language will be the one used in that nation's courts, parliament and administration. However, official status can also be used to give a... and Macau). The oft-cited figure of 300 million is for "learners." |
|
| 18 |  Sweden Sweden |
89% | 9,215,021 | 8,200,000 | 8,200,000 | Source: Eurobarometer report 2006 | |
| 19 |  Cameroon Cameroon |
% | 18,549,000 | 7,700,000 | 7,700,000 | Crystal (2005), p. 109. Note this includes speakers of an English creole. | |
| 20 |  Malaysia Malaysia |
% | 27,170,000 | 7,380,000 | 380,000 | 7,000,000 | Crystal (2005), p. 109. |
| 21 |  Russia Russia |
% | 141,888,900 | 6,955,315 | 1,804 | 6,953,511 | Source: Basic Results, Tables 4.4 and 4.1, Russian Census (2002) Russian Census (2002) Russian Census of 2002 was the first census of the Russian Federation carried out on October 9 through October 16, 2002. It was carried out by the Russian Federal Service of State Statistics .-Resident population:... . The "total" figure is the number of residents who reported English as one of the language they knew. The "first language" figure is the number of residents who reported "American" or "English" as their nationality. The "additional languages" figure is the difference. More than 9 million schoolgoers studied English as a foreign language in 2008-2009. |
| 22 |  Thailand Thailand |
10% | 63,038,247 | 6,549,329 | 6,549,329 | Secondary language of the elite | |
| 23 |  Belgium Belgium |
59% | 10,584,534 | 6,250,000 | 6,250,000 | Source: Eurobarometer report 2006 | |
| 24 |  Israel Israel |
% | 7,303,000 | |6,205,000 | 100,000 | 6,105,000 | Source: Ethnologue (2005) English is widely spoken by all ethnic groups . |
| 25 |  Kingdom of Romania Kingdom of Romania |
29% | 21,438,000 | 6,200,000 | 6,200,000 | Source: Eurobarometer report 2006 | |
| 26 |  Zimbabwe Zimbabwe |
% | 13,349,000 | 5,550,000 | 250,000 | 5,300,000 | Crystal (2005), p. 109. |
| 27 |  Greece Greece |
48% | 11,147,000 | 5,350,000 | 5,350,000 | Source: Eurobarometer report 2006 | |
| 28 |  Sierra Leone Sierra Leone |
% | 5,866,000 | 4,900,000 | 500,000 | 4,400,000 | Crystal (2005), p. 109. Note this includes speakers of an English creole. |
| 29 |  Mexico Mexico |
% | 106,682,500 | 4,855,000 | 4,855,000 | Consulta Mitovsky-Tracking Poll Roy Campos: Las Lenguas Extranjeras en México, April 2007 http://www.consulta.com.mx/interiores/99_pdfs/12_mexicanos_pdf/mxc_NA20070420_LosIdiomasdelMexicano.pdf; and II Conteo de Población y Vivienda, Instituto Nacional de Estadística, Geografía e Informática (INEGI) http://www.inegi.gob.mx/est/default.aspx?c=6789. | |
| 30 |  Austria Austria |
58% | 8,340,924 | 4,800,000 | 4,800,000 | Source: Eurobarometer report 2006 | |
| 31 |  Denmark Denmark |
86% | 5,489,022 | 4,720,000 | 4,720,000 | Source: Eurobarometer report 2006 | |
| 32 |  Switzerland Switzerland |
|% | 7,637,300 | 4,680,000 | 73,400 | 4,606,600 | Figure for speakers of English as "main language", according to Federal Statistical Office, Neuchâtel 2008 Source for number of non-native English speakers is 1999 publication by Prof. François Grin cited here: http://switzerland.isyours.com/e/countries/uk/language.html |
| 33 |  Norway Norway |
4,920,500 | |||||
| 34 |  Republic of Ireland Republic of Ireland |
% | 4,422,100 | 4,350,000 | 4,122,100 | 237,900 | Source: Eurobarometer report 2006; Central Statistics Office http://www.cso.ie; Travbla http://travbla.com/Ireland/en |
| 35 |  Singapore Singapore |
80% | 5,076,700 | 665,087 | 3,396,273 | Source: 2010 Census. Second language speaker figure only includes those literate in English aged 15 or more and does not include third language proficiency. Singapore Census of Population, 2010, Advance Data Release No.1, "Demographic Characteristics, Education, Language and Religion" | |
| 36 |  Tanzania Tanzania |
% | 40,454,000 | 4,000,000 | 4,000,000 | Source: Crystal (2005), p. 109. | |
| 37 |  New Zealand New Zealand |
% | 4,275,100 | 3,673,623 | 3,673,623 | There were 4,027,947 responses to 2006 Census: Language spoken. 3,673,679 gave English as a response, 81,936 had no English but another language. The balance of 272,382 were; no language (too young) 75,195, no response 196,221, response unidentifiable 588, response outside scope 378. Hence it is most meaningful to express the English speaking per cent without including the figures for these 272,382. This gives 97.8% English-speaking, 2.2% non-English-speaking (3,673,679 and 81,936 divided by 3,755,565) Crystal (2005), p. 109, gives figures of 3,700,000 native speakers and 150,000 second language speakers. |
|
| 38 |  Bangladesh Bangladesh |
% | 158,665,000 | 3,500,000 | 3,500,000 | Source: Crystal (2005), p. 109. | |
| 39 |  Finland Finland |
63% | 5,331,483 | 3,400,000 | 3,400,000 | Source: Eurobarometer report 2006 | |
| 40 |  Portugal Portugal |
32% | 10,623,000 | 3,400,000 | 3,400,000 | Source: Eurobarometer report 2006 | |
| 41 |  Lebanon Lebanon |
% | 4,099,000 | 3,300,000 | 3,300,000 | ||
| 42 |  Papua New Guinea Papua New Guinea |
% | 6,331,000 | 3,150,000 | 150,000 | 3,000,000 | Source: Crystal (2005), p. 109. Note this includes speakers of an English creole. |
| 43 |  Liberia Liberia |
% | 3,750,000 | 3,100,000 | 600,000 | 2,500,000 | Source: Crystal (2005), p. 109. Note this includes speakers of an English creole. |
| 44 |  Kenya Kenya |
% | 37,538,000 | 2,700,000 | 2,700,000 | Source: Crystal (2005), p. 109. | |
| 45 |  Jamaica Jamaica |
% | 2,714,000 | 2,650,000 | 2,600,000 | 50,000 | Source: Crystal (2005), p. 109. Note this includes speakers of an English creole. |
| 46 |  Uganda Uganda |
% | 30,884,000 | 2,500,000 | 2,500,000 | Source: Crystal (2005), p. 109. | |
| 47 |  Hong Kong Hong Kong |
% | 6,963,100 | 2,500,000 | 200,000 | 2,300,000 | According to 1996 by-census, Hong Kong has approximately 2.5 million speakers, of whom 200,000 regard English as their "usual" language. |
| 48 |  Czech Republic Czech Republic |
24% | 10,403,136 | 2,500,000 | 2,500,000 | Source: Eurobarometer report 2006 | |
| 49 |  Hungary Hungary |
23% | 10,043,000 | 2,300,000 | 2,300,000 | Source: Eurobarometer report 2006 | |
| 50 |  Independent State of Croatia Independent State of Croatia |
49% | 4,555,000 | 2,200,000 | 2,200,000 | Source: Eurobarometer report 2006 | |
| 51 |  Puerto Rico Puerto Rico |
% | 3,991,000 | 1,940,000 | 100,000 | 1,840,000 | Source: Crystal (2005), p. 109. |
| 52 |  Sri Lanka Sri Lanka |
% | 19,299,000 | 1,910,000 | 10,000 | 1,900,000 | Source: Crystal (2005), p. 109. |
| 52 |  Zambia Zambia |
% | 11,922,000 | 1,910,000 | 110,000 | 1,800,000 | Source: Crystal (2005), p. 109. |
| 53 |  Kazakhstan Kazakhstan |
15.4% | 12,156,705 | 1,874,583 | 602 | 1,873,981 | Number of those who understand spoken English, from these 1.9 million: 311,435 (2.6%/16.6%) can only read, 931,444 (7.7%/49.6%) can read and write in English. The number of native speakers is the sum of Americans and Englishmen "by nationality". (Census 2009) |
| 53 |  Bosnia and Herzegovina Bosnia and Herzegovina |
% | 4,000,000 | 1,800,000 | 1,800,000 | not verified. | |
| 54 |  Kingdom of Bulgaria Kingdom of Bulgaria |
23% | 7,640,238 | 1,800,000 | 1,800,000 | Source: Eurobarometer report 2006 | |
| 55 |  Slovakia Slovakia |
32% | 5,402,273 | 1,700,000 | 1,700,000 | not verified. | |
| 56 |  Ghana Ghana |
% | 23,478,000 | 1,400,000 | 1,400,000 | Source: Crystal (2005), p. 109. Note this includes speakers of an English creole. | |
| 57 |  Slovenia Slovenia |
57% | 2,023,358 | 1,200,000 | 1,200,000 | Source: Eurobarometer report 2006 | |
| 58 |  Trinidad and Tobago Trinidad and Tobago |
87.74% | 1,305,000 | 1,145,000 | 1,145,000 | Source: Crystal (2005), p. 109. Note this includes speakers of an English creole. | |
| 59 |  Lithuania Lithuania |
32% | 3,369,600 | 1,100,000 | 1,100,000 | Source: Eurobarometer report 2006 | |
| 60 |  Latvia Latvia |
39% | 2,270,700 | 900,000 | 900,000 | Source: Eurobarometer report 2006 | |
| 61 |  Guyana Guyana |
90.55% | 751,000 | 680,000 | 650,000 | 30,000 | Source: Crystal (2005), p. 109. Note this includes speakers of an English creole. |
| 62 |  Botswana Botswana |
38.42% | 1,639,833 | 630,000 | 630,000 | Source: Crystal (2005), p. 109. | |
| 63 |  Estonia Estonia |
46% | 1,340,602 | 620,000 | 620,000 | Source: Eurobarometer report 2006 | |
| 64 |  Cyprus Cyprus |
76% | 794,600 | 600,000 | 600,000 | Source: Eurobarometer report 2006 | |
| 65 |  Malawi Malawi |
% | 13,931,831 | 540,209 | 209 | 540,000 | Source: Crystal (2005), p. 109. |
| 66 |  Lesotho Lesotho |
% | 1,795,000 | 500,000 | 500,000 | Source: Crystal (2005), p. 109. | |
| 67 |  Suriname Suriname |
87.09% | 470,784 | 410,000 | 260,000 | 150,000 | Source: Crystal (2005), p. 109. Note this includes speakers of an English creole. |
| 68 |  Malta Malta |
88% | 419,285 | 370,000 | 370,000 | Source: Eurobarometer report 2006 | |
| 69 |  Namibia Namibia |
% | 1,820,916 | 314,000 | 14,000 | 300,000 | Source: Crystal (2005), p. 109. |
| 70 |  Luxembourg Luxembourg |
60% | 480,222 | 290,000 | 290,000 | Source: Eurobarometer report 2006 | |
| 71 |  The Bahamas The Bahamas |
% | 330,549 | 288,000 | 260,000 | 28,000 | Source: Crystal (2005), p. 109. Note this includes speakers of an English creole. |
| 72 |  Barbados Barbados |
% | 279,000 | 275,000 | 262,000 | 13,000 | Source: Crystal (2005), p. 109. Note this includes speakers of an English creole. |
| 73 |  Belize Belize |
% | 301,270 | 246,000 | 190,000 | 56,000 | Source: Crystal (2005), p. 109. Note this includes speakers of an English creole. |
| 74 |  Mauritius Mauritius |
% | 1,264,866 | 202,000 | 2,000 | 200,000 | Source: Crystal (2005), p. 109. |
| 75 |  Vanuatu Vanuatu |
% | 215,446 | 180,000 | 60,000 | 120,000 | Source: Crystal (2005), p. 109. Note this includes speakers of an English creole. |
| 76 |  Fiji Fiji |
% | 853,445 | 176,000 | 6,000 | 170,000 | Source: Crystal (2005), p. 109. |
| 77 |  Solomon Islands Solomon Islands |
% | 552,438 | 175,000 | 10,000 | 165,000 | Source: Crystal (2005), p. 109. Note this includes speakers of an English creole. |
| 78 |  Ethiopia Ethiopia |
% | 78,254,090 | 171,712 | 1,986 | 169,726 | |
| 79 |  Guam Guam |
% | 173,456 | 158,000 | 58,000 | 100,000 | Source: Crystal (2005), p. 109. |
| 80 |  Brunei Brunei |
% | 381,371 | 144,000 | 10,000 | 134,000 | Source: Crystal (2005), p. 109. |
| 81 |  Saint Vincent and the Grenadines Saint Vincent and the Grenadines |
% | 120,000 | 114,000 | 114,000 | Source: Crystal (2005), p. 109. Note this includes speakers of an English creole. | |
| 82 |  United States Virgin Islands United States Virgin Islands |
% | 108,448 | 113,000 | 98,000 | 15,000 | Source: Crystal (2005), p. 109. Note this includes speakers of an English creole. |
| 83 |  Grenada Grenada |
% | 110,000 | 100,000 | 100,000 | Source: Crystal (2005), p. 109. Note this includes speakers of an English creole. | |
| 84 |  Netherlands Antilles Netherlands Antilles |
50% | 192,000 | 96,000 | 96,000 | ||
| 85 |  Samoa Samoa |
49.86% | 188,540 | 94,000 | 1,000 | 93,000 | Source: Crystal (2005), p. 109. |
| 86 |  Isle of Man Isle of Man |
99.93% | 80,058 | 80,000 | 80,000 | ||
| 87 |  Bhutan Bhutan |
% | 658,000 | 75,000 | 75,000 | Source: Crystal (2005), p. 109. | |
| 89 |  Saint Lucia Saint Lucia |
43.04% | 165,000 | 71,000 | 31,000 | 40,000 | Source: Crystal (2005), p. 109. Note this includes speakers of an English creole. |
| 90 |  Northern Mariana Islands Northern Mariana Islands |
83.33% | 84,000 | 70,000 | 5,000 | 65,000 | Source: Crystal (2005), p. 109. Note this includes speakers of an English creole. |
| 91 |  Antigua and Barbuda Antigua and Barbuda |
80% | 85,000 | 68,000 | 66,000 | 2,000 | Source: Crystal (2005), p. 109. Note this includes speakers of an English creole. |
| 92 |  American Samoa American Samoa |
100% | 67,000 | 67,000 | 2,000 | 65,000 | Source: Crystal (2005), p. 109. |
| 93 |  Federated States of Micronesia Federated States of Micronesia |
57.66% | 111,000 | 64,000 | 4,000 | 60,000 | Source: Crystal (2005), p. 109. |
| 94 |  Bermuda Bermuda |
96.92% | 65,000 | 63,000 | 63,000 | Source: Crystal (2005), p. 109. | |
| 95 |  Dominica Dominica |
94.03% | 67,000 | 63,000 | 3,000 | 60,000 | Source: Crystal (2005), p. 109. Note this includes speakers of an English creole. |
| 96 |  Marshall Islands Marshall Islands |
59,000 | 60,000 | 60,000 | Source: Crystal (2005), p. 109. | ||
| 97 |  Swaziland Swaziland |
4.38% | 1,141,000 | 50,000 | 50,000 | Source: Crystal (2005), p. 109. | |
| 98 |  Aruba Aruba |
42.31% | 104,000 | 44,000 | 9,000 | 35,000 | Source: Crystal (2005), p. 109. |
| 99 |  The Gambia The Gambia |
2.34% | 1,709,000 | 40,000 | 40,000 | Source: Crystal (2005), p. 109. Note this includes speakers of an English creole. | |
| 100 |  Saint Kitts and Nevis Saint Kitts and Nevis |
78% | 50,000 | 39,000 | 39,000 | Source: Crystal (2005), p. 109. Note this includes speakers of an English creole. | |
| 101 |  Cayman Islands Cayman Islands |
76.7% | 47,000 | 36,000 | 36,000 | Source: Crystal (2005), p. 109. Note this includes speakers of an English creole. | |
| 102 |  Seychelles Seychelles |
% | 87,000 | 33,000 | 3,000 | 30,000 | Source: Crystal (2005), p. 109. |
| 103 |  Honduras Honduras |
0.44% | 7,106,000 | 31,500 | 31,500 | ||
| 104 |  Gibraltar Gibraltar |
28,875 | 30,000 | 28,000 | 2,000 | Source: Crystal (2005), p. 109. | |
| 105 |  Tonga Tonga |
30% | 100,000 | 30,000 | 30,000 | Source: Crystal (2005), p. 109. | |
| 107 |  Kiribati Kiribati |
24.21% | 95,000 | 23,000 | 23,000 | Source: Crystal (2005), p. 109. | |
| 108 |  Rwanda Rwanda |
% | 9,725,000 | 20,000 | 20,000 | Source: Crystal (2005), p. 109. | |
| 109 |  British Virgin Islands British Virgin Islands |
86.96% | 23,000 | 20,000 | 20,000 | Source: Crystal (2005), p. 109. Note this includes speakers of an English creole. | |
| 110 |  Palau Palau |
92.5% | 20,000 | 18,500 | 500 | 18,000 | Source: Crystal (2005), p. 109. |
| 111 |  Andorra Andorra |
22% | 81,222 | 17,869 | 17,869 | Source Census: Linguistic knowledge 2004. | |
| 112 |  Anguilla Anguilla |
92.31% | 13,000 | 12,000 | 12,000 | Source: Crystal (2005), p. 109. | |
| 113 |  Nauru Nauru |
10,000 | 10,300 | 800 | 9,500 | Source: Crystal (2005), p. 109. | |
| 114 |  Dominican Republic Dominican Republic |
10.98% | 9,760,000 | 15,000 | 15,000 | ||
| 115 |  Saint Helena Saint Helena |
81.82% | 6,600 | 5,400 | 5,400 | ||
| 116 |  Cook Islands Cook Islands |
19.8% | 20,200 | 4,000 | 1,000 | 3,000 | Source: Crystal (2005), p. 109. |
| 117 |  Montserrat Montserrat |
67.8% | 5,900 | 4,000 | 4,000 | Source: Crystal (2005), p. 109. Note this includes speakers of an English creole. | |
| 118 |  British Indian Ocean Territory British Indian Ocean Territory |
100% | 3,500 | 3,500 | 3,500 | ||
| 119 |  Falkland Islands Falkland Islands |
95.54% | 3,140 | 3,000 | 1,991 | 1,009 | |
| 120 |  Niue Niue |
2,160 | 1,600 | 78 | 2,082 | ||
| 121 |  Norfolk Island Norfolk Island |
79.38% | 2,114 | 1,678 | 1,678 | ||
| 122 |  Turks and Caicos Islands Turks and Caicos Islands |
% | 26,000 | 920 | 920 | ||
| 123 |  Guadeloupe Guadeloupe |
% | 408,000 | 200 | 200 | ||
| 124 |  Saint-Pierre and Miquelon Saint-Pierre and Miquelon |
% | 6,125 | 188 | 188 | ||
| 125 |  Pitcairn Islands Pitcairn Islands |
92% | 50 | 46 | 46 | ||
| 126 |  Tokelau Tokelau |
2.86% | 1,400 | 40 | 40 | ||
| World World World is a common name for the whole of human civilization, specifically human experience, history, or the human condition in general, worldwide, i.e. anywhere on Earth.... |
% | 6,736,629,307 | 964,732,362 | 345,246,454 | 619,485,908 | Estimate by Wikipedia contributors. |
The European Union
European Union
The European Union is an economic and political union of 27 independent member states which are located primarily in Europe. The EU traces its origins from the European Coal and Steel Community and the European Economic Community , formed by six countries in 1958...
is a supranational union composed of 27 member states. The combined total English speaking population is 229,850,000 (out of a total population of 500,000,000 – 46%) including 61,850,000 native speakers and 168,000,000 non-native speakers, and would be ranked 2nd if it were included.
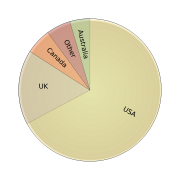
List in order of native speakers
| Rank | Country | First language |
|---|---|---|
| 1 | 225,505,953 | |
| 2 | 58,200,000 | |
| 3 | 18,232,195 | |
| 4 | 15,581,334 | |
| 5 | 4,400,000 | |
| 6 | 3,673,203 | |
| 7 | 3,500,000+ (approx.) | |
| 8 | 3,427,000 | |
| 9 | 2,600,000+ (approx.) | |
| 10 | Trinidad and Tobago |
1,145,000 |
| 11 | 884,418 | |
| 12 | Guyana |
650,000 |
| 13 | Liberia |
600,000 |
| 14 | Sierra Leone |
500,000 |
| 15 | Malaysia |
380,000 |
| 16 | Germany |
272,504 |
| 17 | Barbados |
262,000 |
| 18 | The Bahamas |
260,000 |
| 19 | Zimbabwe |
250,000 |
| 20 | India |
227,000 |
| Hong Kong if ranked separately |
200,000 | |
| 21 | Belize |
190,000 |
| 22 | Papua New Guinea |
150,000 |
| 23 | Saint Vincent and the Grenadines |
114,000 |
| 24 | Zambia |
110,000 |
| 25= | Grenada |
100,000 |
| 25= | Israel |
100,000 |
| 25= | Puerto Rico |
100,000 |
| 28 | United States Virgin Islands |
98,000 |
| 29 |  Japan Japan |
>93,500 |
| 30 | Switzerland |
73,000 |
| 31 | Antigua and Barbuda |
66,000 |
| 32 | Bermuda |
63,000 |
| 33 | Vanuatu |
60,000 |
| 34 | Guam |
58,000 |
| 35 | Saint Kitts and Nevis |
39,000 |
| 36 | Cayman Islands |
36,000 |
| 37 | Honduras |
31,500 |
| 38 | Saint Lucia |
31,000 |
| 39 | Gibraltar |
28,000 |
| 40 | British Virgin Islands |
20,000 |
| 41 | Namibia |
14,000 |
| 42 | Anguilla |
12,000 |
| 43= | Solomon Islands |
10,000 |
| 43= | Sri Lanka |
10,000 |
| 43= | Brunei |
10,000 |
| 46 | Aruba |
9,000 |
| 47 | Dominican Republic |
15,000 |
| 48 | Fiji |
6,000 |
| 49 | Saint Helena |
5,400 |
| 50 | Northern Mariana Islands |
5,000 |
| 51 | Federated States of Micronesia |
4,000 |
| 52 | Montserrat |
4,000 |
| 53 | British Indian Ocean Territory |
3,500 |
| 54= | Dominica |
3,000 |
| 54= | Seychelles |
3,000 |
| 56= | American Samoa |
2,000 |
| 56= | Mauritius |
2,000 |
| 58 | Falkland Islands |
1,991 |
| 59 | Russia |
1,804 |
| 60 | Ethiopia |
1,986 |
| 61 | Norfolk Island |
1,678 |
| 62= | Cook Islands |
1,000 |
| 62= | Samoa |
1,000 |
| 64 | Turks and Caicos Islands |
920 |
| 65 | Nauru |
800 |
| 66 | Palau |
500 |
| 67 | Guadeloupe |
200 |
| 68 | Saint-Pierre and Miquelon |
188 |
| 69 | Niue |
78 |
| 70 | Pitcairn Islands |
46 |
| 71 | Tokelau |
40 |
| 72 |  East Timor East Timor |
30 |
See also
- List of countries where English is an official language
- AnglosphereAnglosphereAnglosphere is a neologism which refers to those nations with English as the most common language. The term can be used more specifically to refer to those nations which share certain characteristics within their cultures based on a linguistic heritage, through being former British colonies...
- English-speaking worldEnglish-speaking worldThe English-speaking world consists of those countries or regions that use the English language to one degree or another. For more information, please see:Lists:* List of countries by English-speaking population...
- World EnglishesWorld EnglishesWorld Englishes refers to the emergence of localised or indigenised varieties of English, especially varieties that have developed in nations colonised by Great Britain or influenced by the United States...
- EF English Proficiency Index (EF EPI)
Non-English:
- Francophonie
- Hispanosphere
- IndosphereIndosphereIndosphere is a subgrouping of Tibeto-Burman languages as defined by linguist James Matisoff, which includes languages that are typologically and morphologically a closeness to Indo-Aryan languages...
- Lusosphere
- RussophoneRussophoneA Russophone is literally a speaker of the Russian language either natively or by preference. At the same time the term is used in a more specialized meaning to describe the category of people whose cultural background is associated with Russian language regardless of ethnic and territorial...
- SinosphereSinosphereIn areal linguistics, Sinosphere refers to a grouping of countries and regions that are currently inhabited with a majority of Chinese population or were historically under Chinese cultural influence...