
Line plot survey
Encyclopedia
Line plot survey is a systematic technique of laying out sample plots in a forest inventory
within a rectangular grid. It is also an application of systematic sampling, similar to statistical properties as random sampling, but often easier to carry out.
Surveys typically are to collect information about seedlings, shrubs, invasive species, signs of wildlife, need for fertilization, timber species count, and/or similar purposes. For statistical control, all sample plots are a precise radius, typically 4 to 8 ft (121.9 to 243.8 cm), and must not include features outside each sampling circle.
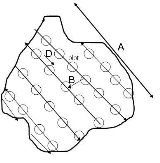
and determine how many plots to take on this survey line. This is done by determining the distance between survey lines (B), the distance between plots (D), and the surface area (A) in the tract. The number of samples to take is

The survey starts in a random distance by picking two random numbers between [0 and B] and [0 and D] for the first plot and line location. Then measure the length to the first plot, survey and repeat. Once at the boundary, turn 90° and continue on to the next transect.
 The line plot survey has the advantage of insuring the inventory includes an even outlay and includes everything in the forested tract.
Examples of this are stand regeneration surveys to assess what is growing in a forest. Transect azimuth of 300° using plots one chain apart in one tenth acre then perhaps moving four chains to the next plot while still on the 300° (degree) bearing.
Forest inventory
Forest inventory is the systematic collection of data and forest information for assessment or analysis. It is also commonly known as timber cruising. It is important for owners to cruise the timber to get an estimate of the value and possible uses of the timber...
within a rectangular grid. It is also an application of systematic sampling, similar to statistical properties as random sampling, but often easier to carry out.
Surveys typically are to collect information about seedlings, shrubs, invasive species, signs of wildlife, need for fertilization, timber species count, and/or similar purposes. For statistical control, all sample plots are a precise radius, typically 4 to 8 ft (121.9 to 243.8 cm), and must not include features outside each sampling circle.
Method
The method is used for forest inventories to accurately estimate the volume standing in a forested tract without counting every single item. Inventory specialists set up a line or bearing on their hand compassHand compass
A hand compass is a term for any compact magnetic compass capable of one-hand use and fitted with a sighting device to record a precise bearing or azimuth to a given target or to determine a location...
and determine how many plots to take on this survey line. This is done by determining the distance between survey lines (B), the distance between plots (D), and the surface area (A) in the tract. The number of samples to take is
The survey starts in a random distance by picking two random numbers between [0 and B] and [0 and D] for the first plot and line location. Then measure the length to the first plot, survey and repeat. Once at the boundary, turn 90° and continue on to the next transect.
Uses
Examples of this are stand regeneration surveys to assess what is growing in a forest. Transect azimuth of 300° using plots one chain apart in one tenth acre then perhaps moving four chains to the next plot while still on the 300° (degree) bearing.