

Keynesian cross
Encyclopedia
Aggregate demand
In macroeconomics, aggregate demand is the total demand for final goods and services in the economy at a given time and price level. It is the amount of goods and services in the economy that will be purchased at all possible price levels. This is the demand for the gross domestic product of a...
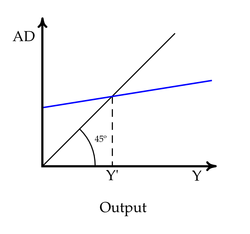
") curve (shown in blue) is drawn as a rising line since consumers will have a larger demand with a rise in disposable income
Disposable income
Disposable income is total personal income minus personal current taxes. In national accounts definitions, personal income, minus personal current taxes equals disposable personal income...
, which increases with total national output. This increase is due to the positive relationship between consumption
Consumption (economics)
Consumption is a common concept in economics, and gives rise to derived concepts such as consumer debt. Generally, consumption is defined in part by comparison to production. But the precise definition can vary because different schools of economists define production quite differently...
and consumers' disposable income in the consumption function
Consumption function
In economics, the consumption function is a single mathematical function used to express consumer spending. It was developed by John Maynard Keynes and detailed most famously in his book The General Theory of Employment, Interest, and Money. The function is used to calculate the amount of total...
. Aggregate demand may also rise due to increases in investment (due to the accelerator effect
Accelerator effect
The accelerator effect in economics refers to a positive effect on private fixed investment of the growth of the market economy . Rising GNP implies that businesses in general see rising profits, increased sales and cash flow, and greater use of existing capacity...
), while this rise is reduced if imports and tax revenues rise with income. Equilibrium in this diagram occurs where total demand, AD, equals the total amount of national output, Y, (which corresponds to total national income or production). Here, total demand equals total supply
Aggregate supply
In economics, aggregate supply is the total supply of goods and services that firms in a national economy plan on selling during a specific time period...
.
In the diagram, the equilibrium
Economic equilibrium
In economics, economic equilibrium is a state of the world where economic forces are balanced and in the absence of external influences the values of economic variables will not change. It is the point at which quantity demanded and quantity supplied are equal...
level of output and demand is determined where this desired spending curve intersects a line that represents the equality of total income and output (AD=Y). The intersection gives the equilibrium output, Y.
The movement toward equilibrium is mostly via changes in inventories inducing changes in production and income. If current output exceeds the equilibrium, inventories accumulate, encouraging businesses to cut back on production, moving the economy toward equilibrium. Similarly, if the level of production is below the equilibrium, then inventories run down, encouraging an increase in production and thus a move toward equilibrium. This equilibration process occurs when the equilibrium is stable, i.e., when the AD line is less steep than the AD=Y line.
The equilibrium level of output determines the equilibrium level of employment in the model. (In a dynamic view, these are connected by Okun's Law
Okun's law
In economics, Okun's law is an empirically observed relationship relating unemployment to losses in a country's production first quantified by Arthur M. Okun. The "gap version" states that for every 1% increase in the unemployment rate, a country's GDP will be at an additional roughly 2% lower...
.) There is no reason within the model why the equilibrium level of employment should correspond to full employment
Full employment
In macroeconomics, full employment is a condition of the national economy, where all or nearly all persons willing and able to work at the prevailing wages and working conditions are able to do so....
. Bringing in other considerations may imply this correspondence, though.
If any of the components of aggregate demand (C + Ip + G + NX) rises at each level of income, for example because business becomes more optimistic about future profitability, that shifts the entire AD line upward. This raises equilibrium income and output. Similarly, if the elements of AD fall, that shifts the line downward and lowers equilibrium output. (The AD=Y line does not shift under the definition used here).
Assumptions
The Keynesian cross produces an equilibrium under several assumptions. First, the AD (blue) curve is positive. The AD curve is assumed to be positive because an increase in national output should lead to an increase in disposable income and, thus, an increase in consumer consumption, which makes up a portion of aggregate demand. Second, the AD curve is assumed to have a positive, vertical intercept. The AD curve must have a positive, vertical intercept to cross the AD=Y curve. If the curves do not cross, there is no equilibrium and no equilibrium output can be determined. The AD curve will have a positive, vertical intercept as long as there is some aggregated demand—from consumer spending, investment, net exports, or government spending—even if there is no national output. The slope of the AD curve is steeper given a high multiplier value.External links
- The Keynesian Cross includes an applet that demonstrates the Keynesian cross and how it responds to changes in underlying parameters
- Keynesian Cross Diagram by Fiona Maclachlan, The Wolfram Demonstrations Project.