
Graphic organizers
Encyclopedia
Graphic organizers are visual representations of knowledge, concepts, thoughts, or ideas. Graphic Organizers historically have been organized bits of data in easy-to-understand formats, such as charts, tables, and graphs.
In the twentieth century, due to developing technologies in printing, the use of graphic organizers grew substantially. Additionally, graphic organizers entered the realm of education in the late twentieth century as ways of helping students to organize their thoughts (as a sort of pre-writing exercise). For example, a student is asked, "What were the causes of the French Revolution?" The student places the question in the middle of a sheet of paper. Branching off of this, the student jots down her ideas, such as "poor harvests," "unfairness of the Old Regime," etc. Branching off of these are more of the student's thoughts, such as "the nobles paid no taxes" branching from "unfairness of the Old Regime." This concept map
thus graphically organizes the student's ideas and knowledge, while serving as the basis of the student's essay answer.
They are known to help:
They take many forms:
In the twentieth century, due to developing technologies in printing, the use of graphic organizers grew substantially. Additionally, graphic organizers entered the realm of education in the late twentieth century as ways of helping students to organize their thoughts (as a sort of pre-writing exercise). For example, a student is asked, "What were the causes of the French Revolution?" The student places the question in the middle of a sheet of paper. Branching off of this, the student jots down her ideas, such as "poor harvests," "unfairness of the Old Regime," etc. Branching off of these are more of the student's thoughts, such as "the nobles paid no taxes" branching from "unfairness of the Old Regime." This concept map
Concept map
For concept maps in generic programming, see Concept .A concept map is a diagram showing the relationships among concepts. It is a graphical tool for organizing and representing knowledge....
thus graphically organizes the student's ideas and knowledge, while serving as the basis of the student's essay answer.
They are known to help:
- relieve learner boredom
- enhances recall
- provide motivation
- create interest
- clarify information
- assist in organizing thoughts
- promote understanding
They take many forms:
- Relational Organizers
- storyboardStoryboardStoryboards are graphic organizers in the form of illustrations or images displayed in sequence for the purpose of pre-visualizing a motion picture, animation, motion graphic or interactive media sequence....
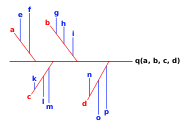
- fishbone -- Ishikawa diagramIshikawa diagramIshikawa diagrams are causal diagrams that show the causes of a certain event -- created by Kaoru Ishikawa . Common uses of the Ishikawa diagram are product design and quality defect prevention, to identify potential factors causing an overall effect...
- cause and effect web
- chartChartA chart is a graphical representation of data, in which "the data is represented by symbols, such as bars in a bar chart, lines in a line chart, or slices in a pie chart"...
- storyboard
- Category/Classification Organizers
- concept mapping
- KWL tables
- mind mapping
- Sequence Organizers
- Chain
- Ladder
- Cycle
- Compare Contrast Organizers
- Dashboard (business)Dashboard (business)Dashboard provides at-a-glance views of key performance indicators relevant to a particular objective or business process...
- Venn diagramVenn diagramVenn diagrams or set diagrams are diagrams that show all possible logical relations between a finite collection of sets . Venn diagrams were conceived around 1880 by John Venn...
s
- Dashboard (business)
- Concept Development Organizers
- story web
- word web
- circle chart
- flow chart
- Options and Control Device Organizers
- mechanical control panelControl panel (engineering)A control panel is a flat, often vertical, area where control or monitoring instruments are displayed.They are found in factories to monitor and control machines or production lines and in places such as nuclear power plants, ships, aircraft and mainframe computers...
- graphical user interfaceGraphical user interfaceIn computing, a graphical user interface is a type of user interface that allows users to interact with electronic devices with images rather than text commands. GUIs can be used in computers, hand-held devices such as MP3 players, portable media players or gaming devices, household appliances and...
- mechanical control panel
See also
- VisualizationVisualization (graphic)Visualization is any technique for creating images, diagrams, or animations to communicate a message. Visualization through visual imagery has been an effective way to communicate both abstract and concrete ideas since the dawn of man...
- KWL tableKWL tableA KWL table, or KWL chart, is a graphical organizer designed to help in learning. The letters KWL are an acronym for "what we know", "what we want to know", and "what we learned". A KWL table is typically divided into three columns titled Know, Want and Learned...
- Thinking MapsThinking MapsThinking Maps are a set of graphic organizer techniques used in K-12 education . There are eight maps that are designed to correspond with eight different fundamental thinking processes...
- Four Square Writing MethodFour Square Writing MethodThe Four Square Writing Method is a simplified graphic organizer for teaching writing to children in school. While primarily used to teach persuasive writing, it has also been used to help teach deconstruction. The method was developed by Judith S...