
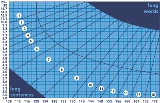
Fry Readability Formula
Encyclopedia
Readability
Readability is the ease in which text can be read and understood. Various factors to measure readability have been used, such as "speed of perception," "perceptibility at a distance," "perceptibility in peripheral vision," "visibility," "the reflex blink technique," "rate of work" , "eye...
metric
Meter (poetry)
In poetry, metre is the basic rhythmic structure of a verse or lines in verse. Many traditional verse forms prescribe a specific verse metre, or a certain set of metres alternating in a particular order. The study of metres and forms of versification is known as prosody...
for English
English language
English is a West Germanic language that arose in the Anglo-Saxon kingdoms of England and spread into what was to become south-east Scotland under the influence of the Anglian medieval kingdom of Northumbria...
texts, developed by Edward Fry.
The grade reading level (or reading difficulty level) is calculated by the average number of sentences (y-axis) and syllables (x-axis) per hundred words. These averages are plotted onto a specific graph; the intersection of the average number of sentences and the average number of syllables determines the reading level of the content.
The formula and graph are often used to provide a common standard by which the readability of documents can be measured. It is sometimes used for regulatory purposes, such as in healthcare, to ensure publications have a level of readability that is understandable and accessible by a wider portion of the population.
Formula
To calculate a grade level score:- Randomly select three separate 100 word passages. (Count every word including proper nouns, initializations, and numerals.)
- Count the number of sentences in each 100 word sample (estimate to nearest tenth).
- Count the number of syllables in each 100 word sample. (Each numeral is a syllable. For example, 2007 is 5 syllables -- two-thou-sand-se-ven -- and one word.)
- Plot the average sentence length and the average number of syllables on the graph.
- The area in which it falls is the approximate grade