
Flux footprint
Encyclopedia
Flux footprint is an upwind area where the atmospheric flux measured by an instrument is generated. Specifically, the term flux footprint describes an upwind area “seen” by the instruments measuring vertical turbulent fluxes, such that heat, water, gas and momentum transport generated in this area is registered by the instruments. Another frequently used term, fetch, usually refers to the distance from the tower when describing the footprint.
 As a practical example, let's consider an instrument measuring a flux of water (evapotranspiration) few meters above the surface in the situation with no wind. In such a case, the instrument would measure evapotranspiration generated just underneath the instrument location and brought upwards by mostly non-turbulent exchange. Now lets consider situation with a strong wind: it would blow air located under the instrument away, would bring in air generated somewhere upwind and brought upwards to a large degree due to turbulent exchange. So, the water flux footprint was just under the instrument in the first case, and was somewhere upwind in the second case.
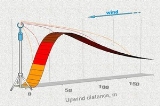
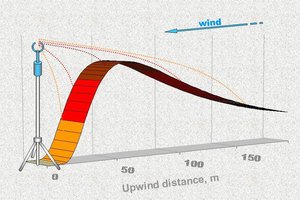
In Figure 1, the general concept of the flux footprint is visualized: the darker the red color – the more contribution that is coming from the surface area certain distance away for the instrument. So, most of the contribution usually comes, not from underneath the instrument or from kilometers away, but rather from somewhere in between. Size and shape of the footprint is also a dynamic area – it changes with time.
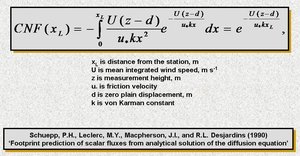 Atmospheric transport can be looked at as a Lagrangian transport model
. In such case, the footprint is the area of cumulative contribution to flux measurement computed from analytical solutions of the diffusion equation. For example, for near-neutral conditions, following Schuepp et al. (1990) and Gash (1986), the mathematical representation of footprint would be that seen in Figure 2.
Increase in measurement height, decrease in surface roughness, and change in atmospheric stability from unstable to stable would lead to an increase in size of the footprint and move peak contribution away from the instrument. The opposite is also true. Decrease in measurement height, increase in surface roughness, and change in atmospheric stability from stable to unstable would lead to a decrease in size of the footprint and move peak contribution closer to the instrument.
 Degree to which flux footprint is affected by these factors is illustrated for the all three respective cases below on the example of actual evapotranspiration flux (ET) measured over prairie in summer time (Figures 3-5).
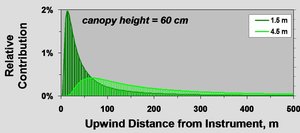
Relative contribution of the land surface area to the flux for two different measurement heights at near-neutral stability is shown in Figure 3. Please note that not only distance to the peak contributing was affected by a measurement height, but magnitude of the peak and overall distribution of the footprint was dramatically affected as well.
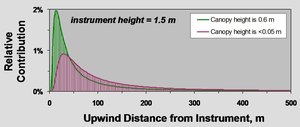
Below is an example of relative contribution of the land surface area to the flux for two different surface roughnesses at near-neutral stability (Figure 4). Area under the curves on the plot above and on the two plots below sums up to nearly 100% of the flux contribution. The remaining few percent of flux are coming from an area beyond 500 m.
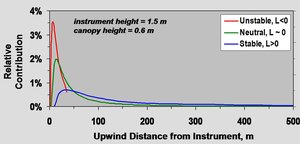
Example of the relative contribution of the land surface area to the flux for two different cases of thermal stability is shown below (Figure 5). This example is adopted from Leclerc, M.Y., and G.W. Thurtell (1990).
Visualization of the concept
In Figure 1, the general concept of the flux footprint is visualized: the darker the red color – the more contribution that is coming from the surface area certain distance away for the instrument. So, most of the contribution usually comes, not from underneath the instrument or from kilometers away, but rather from somewhere in between. Size and shape of the footprint is also a dynamic area – it changes with time.
Mathematical foundation
Lagrangian and Eulerian coordinates
In fluid dynamics and finite-deformation plasticity the Lagrangian specification of the flow field is a way of looking at fluid motion where the observer follows an individual fluid parcel as it moves through space and time. Plotting the position of an individual parcel through time gives the...
. In such case, the footprint is the area of cumulative contribution to flux measurement computed from analytical solutions of the diffusion equation. For example, for near-neutral conditions, following Schuepp et al. (1990) and Gash (1986), the mathematical representation of footprint would be that seen in Figure 2.
Main factors affecting flux footprint
Three main factors affecting the size and shape of flux footprint are:- measurement height
- surface roughness
- atmospheric thermal stability
Increase in measurement height, decrease in surface roughness, and change in atmospheric stability from unstable to stable would lead to an increase in size of the footprint and move peak contribution away from the instrument. The opposite is also true. Decrease in measurement height, increase in surface roughness, and change in atmospheric stability from stable to unstable would lead to a decrease in size of the footprint and move peak contribution closer to the instrument.
Examples of real-field flux footprint distribution
Relative contribution of the land surface area to the flux for two different measurement heights at near-neutral stability is shown in Figure 3. Please note that not only distance to the peak contributing was affected by a measurement height, but magnitude of the peak and overall distribution of the footprint was dramatically affected as well.
Below is an example of relative contribution of the land surface area to the flux for two different surface roughnesses at near-neutral stability (Figure 4). Area under the curves on the plot above and on the two plots below sums up to nearly 100% of the flux contribution. The remaining few percent of flux are coming from an area beyond 500 m.
Example of the relative contribution of the land surface area to the flux for two different cases of thermal stability is shown below (Figure 5). This example is adopted from Leclerc, M.Y., and G.W. Thurtell (1990).
Further reading
- Pages 83-97 in Burba, G., and D. Anderson, 2010. A Brief Practical Guide to Eddy Covariance Flux Measurements: Principles and Workflow Examples for Scientific and Industrial Applications. LI-COR Biosciences, Lincoln, USA, 211 pp.
- Vesala, T., N. Kljun, U. Rannik, J. Rinne, A. Sogachev, T. Markkanen, K. Sabelfeld, Th. Foken and M.Y. Leclerc, 2008. Flux and concentration footprint modelling: State of the art. Environmental Pollution 152, 653-666.
- Schmid, H.P., 2002. Footprint modeling for vegetation atmosphere exchange studies: a review and perspective. Agricultural and Forest Meteorology 113, 159-183.