

Fletcher–Munson curves
Encyclopedia
Harvey Fletcher
Harvey Fletcher was an American physicist. Known as the "father of stereophonic sound" he is credited with the invention of the audiometer and hearing aid...
and Wilden A. Munson, and reported in a paper entitled "Loudness, its definition, measurement and calculation" in Journal of the Acoustic Society of America.
Background
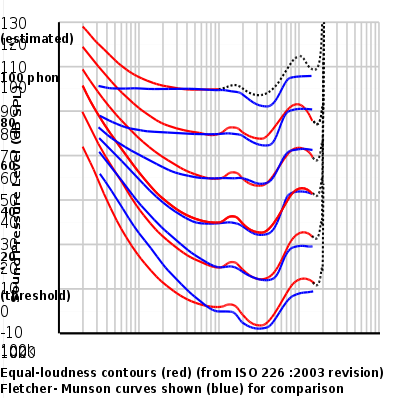
The first research on the topic of how the ear hears different frequencies at different levels was conducted by Fletcher and Munson in 1933. In 1937 they created the first equal-loudness curves. Until recently, it was common to see the term 'Fletcher–Munson' used to refer to equal-loudness contours generally, even though a re-determination was carried out by Robinson and Dadson in 1956 , which became the basis for an ISO 226 standard.It is now better to use the generic term "Equal-loudness contours", especially as a recent survey by ISO redefined the curves in a new standard, ISO 226:2003.
According to the ISO report, the Robinson–Dadson results were the odd one out, differing more from the current standard than did the Fletcher Munson curves. The report states that it is fortunate that the 40-phon
Phon
The phon was proposed in DIN 45631 and ISO 532 B as a unit of perceived loudness level LN for pure tones by S. S. Stevens.-Definition:The purpose of the phon scale is to compensate for the effect of frequency on the perceived loudness of tones...
Fletcher–Munson curve on which the A-weighting
A-weighting
A Weighting curve is a graph of a set of factors, that are used to 'weight' measured values of a variable according to their importance in relation to some outcome. The most commonly known example is frequency weighting in sound level measurement where a specific set of weighting curves known as A,...
standard was based turns out to have been in agreement with modern determinations.
The article also comments on the large differences apparent in the low-frequency region, which remain unexplained. Possible explanations are:
- The equipment used was not properly calibrated.
- The criteria used for judging equal loudness at different frequencies had differed.
- Subjects were not properly rested for days in advance, or were exposed to loud noise in traveling to the tests which tensed the tensor tympaniTensor tympaniThe tensor tympani, the larger of the two muscles of the tympanic cavity, is contained in the bony canal above the osseous portion of the auditory tube...
and stapedius muscles controlling low-frequency mechanical coupling.
See also
- Equal-loudness contourEqual-loudness contourAn equal-loudness contour is a measure of sound pressure , over the frequency spectrum, for which a listener perceives a constant loudness when presented with pure steady tones. The unit of measurement for loudness levels is the phon, and is arrived at by reference to equal-loudness contours...
- Robinson-Dadson curvesRobinson-Dadson curvesThe Robinson–Dadson curves are one of many sets of equal-loudness contours for the human ear, determined experimentally by D. W. Robinson and R. S. Dadson, and reported in a paper entitled "A re-determination of the equal-loudness relations for pure tones" in Br. J. Appl. Phys...
- Weighting filterWeighting filterA weighting filter is used to emphasise or suppress some aspects of a phenomenon compared to others, for measurement or other purposes.- Audio applications :...
- CCIR (ITU) 468 Noise Weighting
- A-weightingA-weightingA Weighting curve is a graph of a set of factors, that are used to 'weight' measured values of a variable according to their importance in relation to some outcome. The most commonly known example is frequency weighting in sound level measurement where a specific set of weighting curves known as A,...
- Audio quality measurementAudio quality measurementAudio quality measurement seeks to quantify the various forms of corruption present in an audio system or device. The results of such measurement are used to maintain standards in broadcasting, to compile specifications, and to compare pieces of equipment....
- Listener fatigue
- Hershberger Reinforcement Curves
- Mel scaleMel scaleThe mel scale, named by Stevens, Volkman and Newman in 1937is a perceptual scale of pitches judged by listeners to be equal in distance from one another. The reference point between this scale and normal frequency measurement is defined by assigning a perceptual pitch of 1000 mels to a 1000 Hz...