
Flag and pennant patterns
Encyclopedia
The flag and pennant patterns are commonly found patterns in the price charts of financially traded assets (stocks, bonds, futures, etc). The patterns are characterized by a clear direction of the price trend, followed by a consolidation and rangebound movement, which is then followed by a resumption of the trend.
. The pole is then formed by a line which represents the primary trend in the market. The pattern is seen as the market potentially just taking a “breather” after a big move before continuing its primary trend. The chart below illustrates.
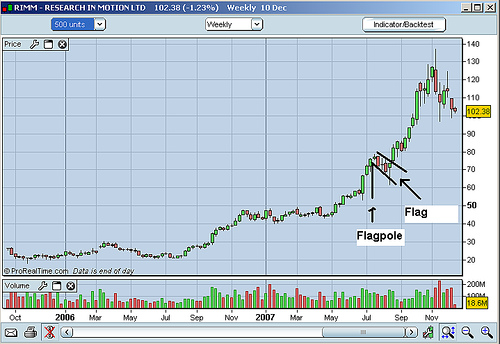
Flag pattern
The flag pattern is encompassed by two parallel lines. These lines can be either flat or pointed in the opposite direction of the primary market trendMarket trend
A market trend is a putative tendency of a financial market to move in a particular direction over time. These trends are classified as secular for long time frames, primary for medium time frames, and secondary for short time frames...
. The pole is then formed by a line which represents the primary trend in the market. The pattern is seen as the market potentially just taking a “breather” after a big move before continuing its primary trend. The chart below illustrates.
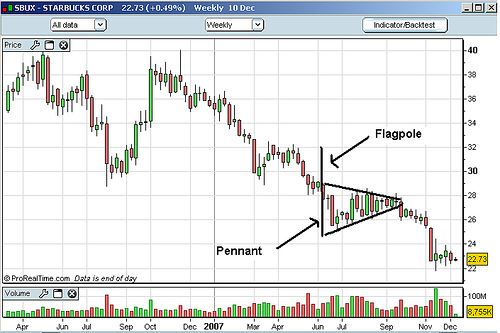
Pennant pattern
The pennant pattern is identical to the flag pattern in its setup and implications; the only difference is that the consolidation phase of a pennant pattern is characterized by converging trendlines rather than parallel trendlines. The image below illustrates.External links
- Analyzing Chart Patterns: Flags And Pennants at investopedia.com