
Event-driven process chain
Encyclopedia
Flowchart
A flowchart is a type of diagram that represents an algorithm or process, showing the steps as boxes of various kinds, and their order by connecting these with arrows. This diagrammatic representation can give a step-by-step solution to a given problem. Process operations are represented in these...
used for business process modelling. EPC's can be used for configuring an enterprise resource planning
Enterprise resource planning
Enterprise resource planning systems integrate internal and external management information across an entire organization, embracing finance/accounting, manufacturing, sales and service, customer relationship management, etc. ERP systems automate this activity with an integrated software application...
(ERP) implementation, and for business process
Business process
A business process or business method is a collection of related, structured activities or tasks that produce a specific service or product for a particular customer or customers...
improvement.
Overview
Businesses use EPC diagrams to lay out business process work flows, originally in conjunction with SAP R/3SAP R/3
SAP R/3 is the former name of the main enterprise resource planning software produced by SAP AG. It is an enterprise-wide information system designed to coordinate all the resources, information, and activities needed to complete business processes such as order fulfillment or billing.- History of...
modeling, but now more widely. There are a number of tools for creating EPC diagrams, ARIS
Architecture of Integrated Information Systems
ARIS is an approach to enterprise modeling. It offers methods for analyzing processes and taking a holistic view of process design, management, work flow, and application processing....
Toolset of IDS Scheer AG, (Now taken over by Software AG ), free modeling tool ARIS Express
ARIS Express
ARIS Express is a free-of-charge modeling tool for business process analysis and management. It supports different modeling notations such as BPMN 2, Event-driven Process Chains , Organizational charts, process landscapes, whiteboards, etc. ARIS Express was initially developed by IDS Scheer, which...
by IDS Scheer AG , ADONIS of BOC Group, Mavim Rules of Mavim BV, Business Process Visual ARCHITECT of Visual Paradigm, Visio of Microsoft Corp., Semtalk of Semtation GmbH, or Bonapart by Pikos GmbH. Some but not all of these tools support the tool-independent EPC Markup Language (EPML) interchange format. There are also tools that generate EPC diagrams from operational data, such as SAP logs. EPC diagrams use symbols of several kinds to show the control flow structure (sequence of decisions, functions, events, and other elements) of a business process.
The EPC method was developed within the framework of ARIS
Architecture of Integrated Information Systems
ARIS is an approach to enterprise modeling. It offers methods for analyzing processes and taking a holistic view of process design, management, work flow, and application processing....
by Prof. Wilhelm-August Scheer at the Institut für Wirtschaftsinformatik at the Universität des Saarlandes in the early 1990s. It is used by many companies for modeling, analyzing, and redesigning business processes. As such it forms the core technique for modeling in ARIS, which serves to link the different views in the so-called control view, which will be elaborated in section of ARIS Business Process Modeling.
To quote from a publication on EPCs: "An EPC is an ordered graph
Ordered graph
An ordered graph is a graph with a total order over its nodes.In an ordered graph, the parents of a node are the nodes that are joined to it and precede it in the ordering...
of events and functions. It provides various connectors that allow alternative and parallel execution of processes. Furthermore it is specified by the usages of logical operators, such as OR, AND, and XOR. A major strength of EPC is claimed to be its simplicity and easy-to-understand notation. This makes EPC a widely acceptable technique to denote business processes."
The statement that EPCs are ordered graphs is also found in other literature, but is probably a misformulation: an ordered graph is a(n undirected) graph with an explicitly provided total node ordering, while EPCs are directed graph
Directed graph
A directed graph or digraph is a pair G= of:* a set V, whose elements are called vertices or nodes,...
s for which no explicit node ordering is provided. No restrictions actually appear to exist on the possible structure of EPCs, but nontrivial structures involving parallelism have ill-defined execution semantics; in this respect they resemble UML activity diagram
Activity diagram
Activity diagrams are graphical representations of workflows of stepwise activities and actions with support for choice, iteration and concurrency. In the Unified Modeling Language, activity diagrams can be used to describe the business and operational step-by-step workflows of components in a system...
s. Several scientific articles are devoted to providing well-defined execution semantics for general EPCs. One particular issue is that EPCs require non-local semantics, i.e., the execution behavior of a particular node within an EPC may depend on the state of other parts of the EPC, arbitrarily far away.
In the following the elements used in EPC diagram will be described:
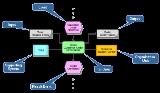
Elements of an event-driven process chain
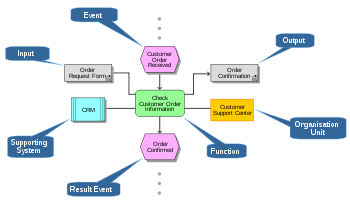
Function : Functions are active elements in EPC. They model the tasks or activities within the company. Functions describe transformations from an initial state to a resulting state. In case different resulting states can occur, the selection of the respective resulting state can be modeled explicitly as a decision function using logical connectors. Functions can be refined into another EPC. In this case it is called hierarchical function. Examples of functions are "capture requirement", "check material on stock", etc. In the EPC graph a function is represented as rounded rectangle.
Organization unit : Organization units determine which person or organization within the structure of an enterprise is responsible for a specific function. Examples are "sales department", "sales manager", "procurement manager", etc. It is represented as an ellipse with a vertical line.
Information, material, or resource object : In the EPC, the information, material, or resource objects portray objects in the real world, for example business objects, entities, etc., which can be input data serving as the basis for a function, or output data produced by a function. Examples are "material", "order", etc. In the EPC graph such an object is represented as rectangle.
Logical connector : In the EPC the logical relationships between elements in the control flow, that is, events and functions are described by logical connectors. With the help of logical connectors it is possible to split the control flow from one flow to two or more flows and to synchronize the control flow from two or more flows to one flow.
 |
 |
Logical relationships
- There are three kinds of logical relationships defined in EPC:
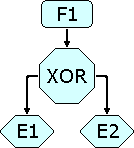
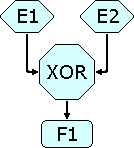
- Branch/Merge : Branch and merge correspond to making decision of which path to choose among several control flows. A branch may have one incoming control flow and two or more outgoing control flows. When the condition is fulfilled, a branch activates exactly only one of the outgoing control flows and deactivates the others. The counterpart of a branch is a merge. A merge may have two or more incoming flows and one outgoing control flow. A merge synchronizes an activated and the deactivated alternatives. The control will then be passed to the next element after the merge. A branch in the EPC is represented by an opening XOR, whereas a merge is represented as a closing XOR connectors.
-
- Fork/Join : Fork and join correspond to activating all paths in the control flow concurrently. A fork may have one incoming control flow and two or more outgoing control flows. When the condition is fulfilled, a fork activates all of the outgoing control flows in parallel. A join may have two or more incoming control flows and one outgoing control flow. A join synchronizes all activated incoming control flows. In the EPC diagram how the concurrency achieved is not a matter. In reality the concurrency can be achieved by true parallelism or by virtual concurrency achieved by interleaving. A fork in the EPC is represented by an opening 'AND', whereas a join is represented as a closing 'AND' connectors.
- OR : An 'OR' relationship corresponds to activating one or more paths among control flows. An opening 'OR' connector may have one incoming control flow and two or more outgoing control flows. When the condition is fulfilled, an opening 'OR' connector activates one or more control flows and deactivates the rest of them. The counterpart of this is the closing 'OR' connector. When at least one of the incoming control flows is activated, the closing 'OR' connector will pass the control to the next element after it.
Control flow : A control flow connects events with functions, process paths, or logical connectors creating chronological sequence and logical interdependencies between them. A control flow is represented as a dashed arrow.
Information flow : Information flows show the connection between functions and input or output data, upon which the function reads changes or writes.
Organization unit assignment : Organization unit assignments show the connection between an organization unit and the function it is responsible for.
Process path : Process paths serve as navigation aid in the EPC. They show the connection from or to other processes. The process path is represented as a compound symbol composed of a function symbol superimposed upon an event symbol. To employ the process path symbol in an EPC diagram, a symbol is connected to the process path symbol, indicating that the process diagramed incorporates the entirety of a second process which, for diagramatic simplicity, is represented by a single symbol.