Electrocardiography is a transthoracic (across the thorax or chest) interpretation of the
electricalElectricity is a general term encompassing a variety of phenomena resulting from the presence and flow of electric charge. These include many easily recognizable phenomena, such as lightning, static electricity, and the flow of electrical current in an electrical wire...
activity of the
heartThe heart is a myogenic muscular organ found in all animals with a circulatory system , that is responsible for pumping blood throughout the blood vessels by repeated, rhythmic contractions...
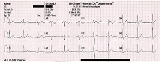
over a period of time, as detected by
electrodeAn electrode is an electrical conductor used to make contact with a nonmetallic part of a circuit...
s attached to the outer surface of the skin and recorded by a device external to the body. The recording produced by this noninvasive procedure is termed as
electrocardiogram (also ECG or EKG). An electrocardiogram (ECG) is a test that records the electrical activity of the heart.
ECG is used to measure the rate and regularity of heartbeats as well as the size and position of the chambers, the presence of any damage to the heart, and the effects of drugs or devices used to regulate the heart (such as a
pacemakerA pacemaker is a medical device that uses electrical impulses, delivered by electrodes contacting the heart muscles, to regulate the beating of the heart...
). See also
stress testCardiac stress test is a test used in medicine and cardiology to measure the heart's ability to respond to external stress in a controlled clinical environment....
and
Holter monitorIn medicine, a Holter monitor is a portable device for continuously monitoring various electrical activity of the cardiovascular system for at least 24 hours...
(24h).
The etymology of the word is derived from the
GreekGreek is an independent branch of the Indo-European family of languages. Native to the southern Balkans, it has the longest documented history of any Indo-European language, spanning 34 centuries of written records. Its writing system has been the Greek alphabet for the majority of its history;...
electro, because it is related to electrical activity,
kardio,
GreekGreek is an independent branch of the Indo-European family of languages. Native to the southern Balkans, it has the longest documented history of any Indo-European language, spanning 34 centuries of written records. Its writing system has been the Greek alphabet for the majority of its history;...
for heart, and
graph, a
GreekGreek is an independent branch of the Indo-European family of languages. Native to the southern Balkans, it has the longest documented history of any Indo-European language, spanning 34 centuries of written records. Its writing system has been the Greek alphabet for the majority of its history;...
root meaning "to write". In English speaking countries, medical professionals often use "EKG" (the abbreviation for the German word
Elektrokardiogramm) in order to avoid confusion with
EEGEEG commonly refers to electroencephalography, a measurement of the electrical activity of the brain.EEG may also refer to:* Emperor Entertainment Group, a Hong Kong-based entertainment company...
in emergency situations where background noise is high.
Most EKGs are performed for diagnostic or research purposes on
human heartThe human heart is a muscular organ that provides a continuous blood circulation through the cardiac cycle and is one of the most vital organs in the human body...
s, but may also be performed on animals, usually for research.
Function
The EKG device detects and amplifies the tiny electrical changes on the skin that are caused when the heart muscle
depolarizesIn biology, depolarization is a change in a cell's membrane potential, making it more positive, or less negative. In neurons and some other cells, a large enough depolarization may result in an action potential...
during each
heartbeatThe cardiac cycle is a term referring to all or any of the events related to the flow or blood pressure that occurs from the beginning of one heartbeat to the beginning of the next. The frequency of the cardiac cycle is described by the heart rate. Each beat of the heart involves five major stages...
. At rest, each heart muscle cell has a negative charge (membrane potential) across its outer wall (or
cell membraneThe cell membrane or plasma membrane is a biological membrane that separates the interior of all cells from the outside environment. The cell membrane is selectively permeable to ions and organic molecules and controls the movement of substances in and out of cells. It basically protects the cell...
). Increasing this negative charge towards zero (via the influx of the positive ions, Na+ and Ca++) is called depolarization, which activates the mechanisms in the cell that cause it to contract. During each heartbeat a healthy heart will have an orderly progression of a wave of depolarisation that is triggered by the cells in the
sinoatrial nodeThe sinoatrial node is the impulse-generating tissue located in the right atrium of the heart, and thus the generator of normal sinus rhythm. It is a group of cells positioned on the wall of the right atrium, near the entrance of the superior vena cava...
, spreads out through the atrium, passes through "intrinsic conduction pathways" and then spreads all over the
ventricleIn the heart, a ventricle is one of two large chambers that collect and expel blood received from an atrium towards the peripheral beds within the body and lungs. The Atria primes the Pump...
s. This is detected as tiny rises and falls in the
voltageVoltage, otherwise known as electrical potential difference or electric tension is the difference in electric potential between two points — or the difference in electric potential energy per unit charge between two points...
between two electrodes placed either side of the heart which is displayed as a wavy line either on a screen or on paper. This display indicates the overall rhythm of the heart and weaknesses in different parts of the heart muscle.
Usually more than 2 electrodes are used and they can be combined into a number of pairs (For example: Left arm (LA), right arm (RA) and left leg (LL) electrodes form the three pairs LA+RA, LA+LL, and RA+LL). The output from each pair is known as a
lead. Each lead is said to look at the heart from a different angle. Different types of EKGs can be referred to by the number of leads that are recorded, for example 3-lead, 5-lead or 12-lead EKGs (sometimes simply "a 12-lead"). A 12-lead EKG is one in which 12 different electrical signals are recorded at approximately the same time and will often be used as a one-off recording of an EKG, traditionally printed out as a paper copy. 3- and 5-lead EKGs tend to be monitored continuously and viewed only on the
screen- Separation or partitioning :* Window screen, a wire mesh that covers a window opening* Fire screen, a device to put in front of a fireplace* Windbreak of trees or shrubs* Windshield , protects the driver of a vehicle...
of an appropriate monitoring device, for example during an operation or whilst being transported in an ambulance. There may or may not be any permanent record of a 3- or 5-lead EKG, depending on the equipment used.
It is the best way to measure and diagnose abnormal rhythms of the heart, particularly abnormal rhythms caused by damage to the conductive tissue that carries electrical signals, or abnormal rhythms caused by electrolyte imbalances. In a
myocardial infarctionMyocardial infarction or acute myocardial infarction , commonly known as a heart attack, results from the interruption of blood supply to a part of the heart, causing heart cells to die...
(MI), the EKG can identify if the heart muscle has been damaged in specific areas, though not all areas of the heart are covered. The EKG cannot reliably measure the pumping ability of the heart, for which ultrasound-based (
echocardiographyAn echocardiogram, often referred to in the medical community as a cardiac ECHO or simply an ECHO, is a sonogram of the heart . Also known as a cardiac ultrasound, it uses standard ultrasound techniques to image two-dimensional slices of the heart...
) or
nuclear medicineIn nuclear medicine procedures, elemental radionuclides are combined with other elements to form chemical compounds, or else combined with existing pharmaceutical compounds, to form radiopharmaceuticals. These radiopharmaceuticals, once administered to the patient, can localize to specific organs...
tests are used. It is possible for a human or other animal to be in
cardiac arrestCardiac arrest, is the cessation of normal circulation of the blood due to failure of the heart to contract effectively...
but still have a normal EKG signal (a condition known as
pulseless electrical activityPulseless electrical activity or PEA refers a cardiac arrest situation in which a heart rhythm is observed on the electrocardiogram that should be producing a pulse, but is not...
).
History
Alexander MuirheadAlexander Muirhead, FRS, born in East Saltoun, East Lothian, Scotland was an electrical engineer specialising in wireless telegraphy.-Biography:...
is reported to have attached wires to a feverish patient's wrist to obtain a record of the patient's heartbeat while studying for his
Doctor of ScienceDoctor of Science , usually abbreviated Sc.D., D.Sc., S.D. or Dr.Sc., is an academic research degree awarded in a number of countries throughout the world. In some countries Doctor of Science is the name used for the standard doctorate in the sciences, elsewhere the Sc.D...
(in electricity) in 1872 at
St Bartholomew's HospitalSt Bartholomew's Hospital, also known as Barts, is a hospital in Smithfield in the City of London, England.-Early history:It was founded in 1123 by Raherus or Rahere , a favourite courtier of King Henry I...
. This activity was directly recorded and visualized using a
Lippmann capillary electrometerA Lippmann electrometer is a device for detecting small rushes of electric current and was invented by Gabriel Lippmann. The device consists of a tube which is thick on one end and very thin on the other. The thin end is designed to act as a capillary tube. The tube is half-filled with mercury with...
by the British physiologist John Burdon Sanderson.
The first to systematically approach the heart from an electrical point-of-view was
Augustus WallerAugustus Desiré Waller FRS was a British physiologist and the son of Augustus Volney Waller. He was born in Paris, France.He created the first practical ECG machine with surface electrodes.He died in London.-Further reading:...
, working in
St Mary's HospitalSt Mary's Hospital is a hospital located in Paddington, London, England that was founded in 1845. Since the UK's first academic health science centre was created in 2008, it is operated by Imperial College Healthcare NHS Trust, which also operates Charing Cross Hospital, Hammersmith Hospital,...
in
PaddingtonPaddington is a district within the City of Westminster, in central London, England. Formerly a metropolitan borough, it was integrated with Westminster and Greater London in 1965...
,
LondonLondon is the capital city of :England and the :United Kingdom, the largest metropolitan area in the United Kingdom, and the largest urban zone in the European Union by most measures. Located on the River Thames, London has been a major settlement for two millennia, its history going back to its...
. His electrocardiograph machine consisted of a Lippmann capillary electrometer fixed to a projector. The trace from the heartbeat was projected onto a photographic plate which was itself fixed to a toy train. This allowed a heartbeat to be recorded in real time. In 1911 he still saw little clinical application for his work.
An initial breakthrough came when
Willem EinthovenWillem Einthoven was a Dutch doctor and physiologist. He invented the first practical electrocardiogram in 1903 and received the Nobel Prize in Medicine in 1924 for it....
, working in
Leiden,
NetherlandsThe Netherlands is a constituent country of the Kingdom of the Netherlands, located mainly in North-West Europe and with several islands in the Caribbean. Mainland Netherlands borders the North Sea to the north and west, Belgium to the south, and Germany to the east, and shares maritime borders...
, used the
string galvanometerThe string galvanometer was one of the earliest instruments capable of detecting and recording the very small electrical currents produced by the human heart and provided the first practical Electrocardiogram . The original machines achieved "such amazing technical perfection that many modern day...
that he invented in 1903. This device was much more sensitive than both the capillary electrometer that Waller used and the string galvanometer that had been invented separately in 1897 by the French engineer Clément Ader. Rather than using today's self-adhesive electrodes Einthoven's subjects would immerse each of their limbs into containers of salt solutions from which the EKG was recorded.
Einthoven assigned the letters P, Q, R, S and T to the various deflections,
Naming of the Waves in the ECG and described the electrocardiographic features of a number of cardiovascular disorders. In 1924, he was awarded the Nobel Prize in Medicine for his discovery.
Though the basic principles of that era are still in use today, there have been many advances in electrocardiography over the years. The instrumentation, for example, has evolved from a cumbersome laboratory apparatus to compact electronic systems that often include computerized interpretation of the electrocardiogram.
EKG graph paper
The output of an ECG recorder is a
graphA chart is a graphical representation of data, in which "the data is represented by symbols, such as bars in a bar chart, lines in a line chart, or slices in a pie chart"...
(or sometimes several graphs, representing each of the leads) with time represented on the
x-axis and voltage represented on the
y-axis. A dedicated ECG machine would usually print onto
graph paperGraph paper, graphing paper, grid paper or millimeter paper is writing paper that is printed with fine lines making up a regular grid. The lines are often used as guides for plotting mathematical functions or experimental data and drawing diagrams. It is commonly found in mathematics and...
which has a background pattern of 1mm squares (often in red or green), with bold divisions every 5 mm in both vertical and horizontal directions.
It is possible to change the output of most ECG devices but it is standard to represent each mV on the y axis as 1 cm and each second as 25 mm on the
x-axis (that is a paper speed of 25 mm/s). Faster paper speeds can be used, for example, to resolve finer detail in the ECG. At a paper speed of 25 mm/s, one small block of ECG paper translates into 40 ms. Five small blocks make up one large block, which translates into 200 ms. Hence, there are five large blocks per second. A
calibrationCalibration is a comparison between measurements – one of known magnitude or correctness made or set with one device and another measurement made in as similar a way as possible with a second device....
signal may be included with a record. A standard signal of 1 mV must move the stylus vertically 1 cm, that is, two large squares on ECG paper.
Layout
By definition, a 12-lead ECG will show a short segment of the recording of each of the 12-leads. This is often arranged in a grid of 4 columns by three rows, the first columns being the limb leads (I,II and III), the second column the augmented limb leads (aVR, aVL and aVF) and the last two columns being the chest leads (V1-V6). It is usually possible to change this layout so it is vital to check the labels to see which lead is represented. Each column will usually record the same moment in time for the three leads and then the recording will switch to the next column which will record the heart beats after that point. It is possible for the heart rhythm to change between the columns of leads.
Each of these segments is short, perhaps 1g-3 heart beats only, depending on the heart rate and it can be difficult to analyse any heart rhythm that shows changes between heart beats. To help with the analysis it is common to print one or two "rhythm strips" as well. This will usually be lead II (which shows the electrical signal from the atrium, the P-wave, well) and shows the rhythm for the whole time the ECG was recorded (usually 5–6 seconds). Some ECG machines will print a second lead II along the very bottom of the paper in addition to the output described above. This printing of Lead II is continuous from start to finish of the process.
The term "rhythm strip" may also refer to the whole printout from a continuous monitoring system which may show only one lead and is either initiated by a clinician or in response to an alarm or event.
Leads
The term "lead" in electrocardiography causes much confusion because it is used to refer to two
different things. In accordance with common parlance the word lead may be used to refer to the electrical cable attaching the
electrodeAn electrode is an electrical conductor used to make contact with a nonmetallic part of a circuit...
s to the ECG recorder. As such it may be acceptable to refer to the "left arm lead" as the electrode (and its cable) that should be attached at or near the left arm. There are usually ten of these electrodes in a standard "12-lead" ECG.
Alternatively (and some would say properly, in the context of electrocardiography) the word
lead may refer to the tracing of the
voltageVoltage, otherwise known as electrical potential difference or electric tension is the difference in electric potential between two points — or the difference in electric potential energy per unit charge between two points...
difference between two of the electrodes and is what is actually produced by the ECG recorder. Each will have a specific name. For example "Lead I" (lead one) is the voltage between the right arm electrode and the left arm electrode, whereas "Lead II" (lead two) is the voltage between the right limb and the feet. (This rapidly becomes more complex as one of the "electrodes" may in fact be a composite of the electrical signal from a combination of the other electrodes (see later). Twelve of this type of lead form a "12-lead" ECG
To cause additional confusion the term "limb leads" usually refers to the tracings from leads I, II and III rather than the electrodes attached to the limbs.
Placement of electrodes
Ten electrodes are used for a 12-lead ECG. The electrodes usually consist of a conducting gel, embedded in the middle of a self-adhesive pad onto which cables clip. Sometimes the gel also forms the adhesive. They are labeled and placed on the patient's body as follows:
. * Note that when exercise stress tests are performed, limb leads may be placed on the trunk to avoid artifacts while ambulatory (arm leads moved sub-clavicularly and leg leads medial to and above the iliac crest).
| Electrode label (in the USA) |
Electrode placement |
| RA |
On the right arm, avoiding thick muscle. |
| LA |
In the same location that RA was placed, but on the left arm. |
| RL |
On the right leg, lateral calf muscle |
| LL |
In the same location that RL was placed, but on the left leg. |
| V1 |
In the fourth intercostal space (between ribs 4 & 5) just to the right of the sternum (breastbone). |
| V2 |
In the fourth intercostal space (between ribs 4 & 5) just to the left of the sternum. |
| V3 |
Between leads V2 and V4. |
| V4 |
In the fifth intercostal space (between ribs 5 & 6) in the mid-clavicular line (the imaginary line that extends down from the midpoint of the clavicle (collarbone)). |
| V5 |
Horizontally even with V4, but in the anterior axillary line. (The anterior axillary line is the imaginary line that runs down from the point midway between the middle of the clavicle and the lateral end of the clavicle; the lateral end of the collarbone is the end closer to the arm.) |
| V6 |
Horizontally even with V4 and V5 in the midaxillary line. (The midaxillary line is the imaginary line that extends down from the middle of the patient's armpit.) |
Additional electrodes
The classical 12-lead ECG can be extended in a number of ways in an attempt to improve its sensitivity in detecting
myocardial infarctionMyocardial infarction or acute myocardial infarction , commonly known as a heart attack, results from the interruption of blood supply to a part of the heart, causing heart cells to die...
involving territories not normally "seen" well. This includes an rV
4 lead which uses the equivalent landmarks to the V
4 but on the
right side of the chest wall and extending the chest leads onto the back with a V
7, V
8 and V
9.
Limb leads
In both the 5- and 12-lead configuration, leads I, II and III are called
limb leads. The electrodes that form these signals are located on the limbs—one on each arm and one on the left leg. The limb leads form the points of what is known as
Einthoven's triangle.
- Lead I is the voltage between the (positive) left arm (LA) electrode and right arm (RA) electrode:

- Lead II is the voltage between the (positive) left leg (LL) electrode and the right arm (RA) electrode:

- Lead III is the voltage between the (positive) left leg (LL) electrode and the left arm (LA) electrode:

Simplified electrocardiograph sensors designed for teaching purposes at e.g. high school level are generally limited to three arm electrodes serving similar purposes.
Unipolar vs. bipolar leads
There are two types of leads: unipolar and bipolar. Bipolar leads have one positive and one negative pole. In a 12-lead ECG, the limb leads (I, II and III) are bipolar leads. Unipolar leads also have two poles, as a voltage is measured; however, the negative pole is a composite pole (Wilson's central terminal, or WCT) made up of signals from lots of other electrodes. In a 12-lead ECG, all leads besides the limb leads are unipolar (aVR, aVL, aVF, V1, V2, V3, V4, V5, and V6).
Wilson's central terminal VW is produced by connecting the electrodes, RA; LA; and LL, together, via a simple resistive network, to give an average potential across the body, which approximates the potential at infinity (i.e. zero):
Augmented limb leads
Leads aVR, aVL, and aVF are augmented limb leads (after their inventor Dr. Emanuel Goldberger known collectively as the Goldberger's leads). They are derived from the same three electrodes as leads I, II, and III. However, they view the heart from different angles (or vectors) because the negative electrode for these leads is a modification of Wilson's central terminal. This zeroes out the negative electrode and allows the positive electrode to become the "exploring electrode". This is possible because Einthoven's Law states that I + (−II) + III = 0. The equation can also be written I + III = II. It is written this way (instead of I − II + III = 0) because Einthoven reversed the polarity of lead II in Einthoven's triangle, possibly because he liked to view upright QRS complexThe QRS complex is a name for the combination of three of the graphical deflections seen on a typical electrocardiogram . It is usually the central and most visually obvious part of the tracing. It corresponds to the depolarization of the right and left ventricles of the human heart...
es. Wilson's central terminal paved the way for the development of the augmented limb leads aVR, aVL, aVF and the precordial leads V1, V2, V3, V4, V5 and V6.
- Lead augmented vector right (aVR) has the positive electrode (white) on the right arm. The negative electrode is a combination of the left arm (black) electrode and the left leg (red) electrode, which "augments" the signal strength of the positive electrode on the right arm:
- Lead augmented vector left (aVL) has the positive (black) electrode on the left arm. The negative electrode is a combination of the right arm (white) electrode and the left leg (red) electrode, which "augments" the signal strength of the positive electrode on the left arm:

- Lead augmented vector foot (aVF) has the positive (red) electrode on the left leg. The negative electrode is a combination of the right arm (white) electrode and the left arm (black) electrode, which "augments" the signal of the positive electrode on the left leg:

The augmented limb leads aVR, aVL, and aVF are amplified in this way because the signal is too small to be useful when the negative electrode is Wilson's central terminal. Together with leads I, II, and III, augmented limb leads aVR, aVL, and aVF form the basis of the hexaxial reference systemThe hexaxial reference system is a diagram based on the first six leads of the 12 lead electrocardiogram. It is used to help determine the heart's electrical axis in the frontal plane....
, which is used to calculate the heart's electrical axis in the frontal plane. The aVR, aVL, and aVF leads can also be represented using the I and II limb leads:

Precordial leads
The electrodes for the precordial leads (V1, V2, V3, V4, V5 and V6) are placed directly on the chest. Because of their close proximity to the heart, they do not require augmentation. Wilson's central terminal is used for the negative electrode, and these leads are considered to be unipolar (recall that Wilson's central terminal is the average of the three limb leads. This approximates common, or average, potential over the body). The precordial leads view the heart's electrical activity in the so-called horizontal plane. The heart's electrical axis in the horizontal plane is referred to as the Z axis.1-9=9
/232222'./.;'./..'=1000000
Waves and intervals
A typical ECG tracing of the cardiac cycle (heartbeat) consists of a P wave, a QRS complex, a T wave, and a U wave which is normally visible in 50 to 75% of ECGs. The baseline voltage of the electrocardiogram is known as the isoelectric line. Typically the isoelectric line is measured as the portion of the tracing following the T wave and preceding the next P wave.
| Feature |
Description |
Duration |
| RR interval |
The interval between an R wave and the next R wave . Normal resting heart rate is between 60 and 100 bpm |
0.6 to 1.2s |
| P wave In electrocardiography, during normal atrial depolarization, the main electrical vector is directed from the SA node towards the AV node, and spreads from the right atrium to the left atrium...
|
During normal atrial depolarization, the main electrical vector is directed from the SA node towards the AV node, and spreads from the right atrium In anatomy, the atrium , sometimes called auricle , refers to a chamber or space. For example, the term is used for a portion of the lateral ventricle in the brain and the blood collection chamber of the heart... to the left atriumIn anatomy, the atrium , sometimes called auricle , refers to a chamber or space. For example, the term is used for a portion of the lateral ventricle in the brain and the blood collection chamber of the heart... . This turns into the P wave on the ECG. |
80ms |
| PR interval In electrocardiography, the PR interval is measured from the beginning of the P wave to the beginning of the QRS complex. It is usually 120 to 200 ms long. On the usual 25 mm/s ECG tracing, this corresponds to 3 to 5 small boxes. The PR interval reflects the time the electrical impulse takes to...
|
The PR interval is measured from the beginning of the P wave to the beginning of the QRS complex. The PR interval reflects the time the electrical impulse takes to travel from the sinus node through the AV node and entering the ventricles. The PR interval is therefore a good estimate of AV node function. |
120 to 200ms |
| PR segment |
The PR segment connects the P wave and the QRS complex. This coincides with the electrical conduction from the AV node to the bundle of His to the bundle branches and then to the Purkinje Fibers. This electrical activity does not produce a contraction directly and is merely traveling down towards the ventricles and this shows up flat on the ECG. The PR interval is more clinically relevant. |
50 to 120ms |
| QRS complex The QRS complex is a name for the combination of three of the graphical deflections seen on a typical electrocardiogram . It is usually the central and most visually obvious part of the tracing. It corresponds to the depolarization of the right and left ventricles of the human heart...
|
The QRS complex reflects the rapid depolarization of the right and left ventricles. They have a large muscle mass compared to the atria and so the QRS complex usually has a much larger amplitude than the P-wave. |
80 to 120ms |
| J-point |
The point at which the QRS complex finishes and the ST segment begins. Used to measure the degree of ST elevation or depression present. |
N/A |
| ST segment In electrocardiography, the ST segment connects the QRS complex and the T wave and has a duration of 0.08 to 0.12 sec .It starts at the J point and ends at the beginning of the T wave...
|
The ST segment connects the QRS complex and the T wave. The ST segment represents the period when the ventricles are depolarized. It is isoelectric. |
80 to 120ms |
| T wave In electrocardiography, the T wave represents the repolarization of the ventricles. The interval from the beginning of the QRS complex to the apex of the T wave is referred to as the absolute refractory period. The last half of the T wave is referred to as the relative refractory period...
|
The T wave represents the repolarization (or recovery) of the ventricles. The interval from the beginning of the QRS complex to the apex of the T wave is referred to as the absolute refractory period. The last half of the T wave is referred to as the relative refractory period (or vulnerable period). |
160ms |
| ST interval |
The ST interval is measured from the J point to the end of the T wave. |
320ms |
| QT interval In cardiology, the QT interval is a measure of the time between the start of the Q wave and the end of the T wave in the heart's electrical cycle. In general, the QT interval represents electrical depolarization and repolarization of the left and right ventricles...
|
The QT interval In cardiology, the QT interval is a measure of the time between the start of the Q wave and the end of the T wave in the heart's electrical cycle. In general, the QT interval represents electrical depolarization and repolarization of the left and right ventricles... is measured from the beginning of the QRS complex to the end of the T wave. A prolonged QT interval is a risk factor for ventricular tachyarrhythmias and sudden death. It varies with heart rate and for clinical relevance requires a correction for this, giving the QTc. |
300 to 430ms |
| U wave The U wave is a wave on an electrocardiogram that is not always seen. It is typically small, and, by definition, follows the T wave. U waves are thought to represent repolarization of the papillary muscles or Purkinje fibers.-Interpretation:...
|
The U wave is hypothesized to be caused by the repolarization of the interventricular septum. They normally have a low amplitude, and even more often completely absent. They always follow the T wave and also follow the same direction in amplitude. If they are too prominent we suspect hypokalemia, hypercalcemia or hyperthyroidism usually. |
| J wave |
The J wave, elevated J-Point or Osborn Wave appears as a late delta wave following the QRS or as a small secondary R wave . It is considered pathognomonic Pathognomonic is a term, often used in medicine, that means characteristic for a particular disease. A pathognomonic sign is a particular sign whose presence means that a particular disease is present beyond any doubt... of hypothermiaHypothermia is a condition in which core temperature drops below the required temperature for normal metabolism and body functions which is defined as . Body temperature is usually maintained near a constant level of through biologic homeostasis or thermoregulation... or hypocalcemia. |
|
There were originally four deflections, but after the mathematical correction for artifacts introduced by early amplifiers, five deflections were discovered. Einthoven chose the letters P, Q, R, S, and T to identify the tracing which was superimposed over the uncorrected labeled A, B, C, and D.
In intracardiac electrocardiograms, such as can be acquired from pacemaker sensors, an additional wave that can be seen is the H deflection, which reflects the depolarization of the bundle of HisThe bundle of His, known as the AV bundle or atrioventricular bundle, is a collection of heart muscle cells specialized for electrical conduction that transmits the electrical impulses from the AV node to the point of the apex of the fascicular branches...
. The H-V interval, in turn, is the duration from the beginning of the H deflection to the earliest onset of ventricular depolarization recorded in any lead.
Vectors and views
Interpretation of the ECG relies on the idea that different leads (by which we mean the ECG leads I,II,III, aVR, aVL, aVF and the chest leads) "view" the heart from different angles.
This has two benefits. Firstly, leads which are showing problems (for example ST segment elevation) can be used to infer which region of the heart is affected. Secondly, the overall direction of travel of the wave of depolarisation can also be inferred which can reveal other problems. This is termed the cardiac axis . Determination of the cardiac axis relies on the concept of a vector which describes the motion of the depolarisation wave. This vector can then be described in terms of its components in relation to the direction of the lead considered. One component will be in the direction of the lead and this will be revealed in the behaviour of the QRS complex and one component will be at 90 degrees to this (which will not). Any net positive deflection of the QRS complex (i.e. height of the R-wave minus depth of the S-wave) suggests that the wave of depolarisation is spreading through the heart in a direction that has some component (of the vector) in the same direction as the lead in question.
Axis
The heart's electrical axis refers to the general direction of the heart's depolarization wavefront (or mean electrical vector) in the frontal plane. With a healthy conducting system the cardiac axis is related to where the major muscle bulk of the heart lies. Normally this is the left ventricle with some contribution from the right ventricle. It is usually oriented in a right shoulder to left leg direction, which corresponds to the left inferior quadrant of the hexaxial reference systemThe hexaxial reference system is a diagram based on the first six leads of the 12 lead electrocardiogram. It is used to help determine the heart's electrical axis in the frontal plane....
, although −30° to +90° is considered to be normal. If the left ventricle increases its activity or bulk then there is said to be "left axis deviation" as the axis swings round to the left beyond -30°, alternatively in conditions where the right ventricle is strained or hypertrophied then the axis swings round beyond +90° and "right axis deviation" is said to exist. Disorders of the conduction system of the heart can disturb the electrical axis without necessarily reflecting changes in muscle bulk.
| Normal |
−30° to 90° |
Normal |
Normal |
| Left axis deviation Left axis deviation is a condition whereby the mean electrical axis of ventricular contraction of the heart lies in a frontal plane direction between -30° and -90°...
|
−30° to −90° |
May indicate left anterior fascicular block or Q waves from inferior MIMyocardial infarction or acute myocardial infarction , commonly known as a heart attack, results from the interruption of blood supply to a part of the heart, causing heart cells to die... . |
Left axis deviation is considered normal in pregnant women and those with emphysemaEmphysema is a long-term, progressive disease of the lungs that primarily causes shortness of breath. In people with emphysema, the tissues necessary to support the physical shape and function of the lungs are destroyed. It is included in a group of diseases called chronic obstructive pulmonary... . |
| Right axis deviation Right Axis Deviation is a congenital heart condition wherein the electrical conduction of the heart is greater than +105 degrees. Between +90 degrees and +180 degrees the condition may be termed Indeterminate Deviation or more often Extreme Right Axis Deviation...
|
+90° to +180° |
May indicate left posterior fascicular block, Q waves from high lateral MIMyocardial infarction or acute myocardial infarction , commonly known as a heart attack, results from the interruption of blood supply to a part of the heart, causing heart cells to die... , or a right ventricular strain pattern. |
Right deviation is considered normal in children and is a standard effect of dextrocardiaDextrocardia is a congenital defect in which the heart is situated on the right side of the body. There are two main types of dextrocardia: dextrocardia of embryonic arrest and dextrocardia situs inversus... . |
| Extreme right axis deviation |
+180° to −90° |
Is rare, and considered an 'electrical no-man's land'. |
|

In the setting of right bundle branch blockA right bundle branch block is a defect in the heart's electrical conduction system.During a right bundle branch block, the right ventricle is not directly activated by impulses travelling through the right bundle branch. The left ventricle however, is still normally activated by the left bundle...
, right or left axis deviation may indicate bifascicular blockBifascicular block is a conduction abnormality in the heart where two of the three main fascicles of the His/Purkinje system are blocked.Most commonly, it refers to a combination of right bundle branch block and either left anterior fascicular block or left posterior fascicular block , with the...
.
Clinical lead groups
There are twelve leads in total, each recording the electrical activity of the heart from a different perspective, which also correlate to different anatomical areas of the heart for the purpose of identifying acute coronary ischemia or injury. Two leads that look at neighbouring anatomical areas of the heart are said to be contiguous (see color coded chart). The relevance of this is in determining whether an abnormality on the ECG is likely to represent true disease or a spurious finding.

| Category |
Color on chart |
Leads |
Activity |
| Inferior leads |
Yellow |
Leads II, III and aVF |
Look at electrical activity from the vantage point of the inferior Inferior means of lower station, rank, degree, or grade . It may also refer to:* Inferiority complex* An anatomical term of location* Inferior angle of the scapula, in the human skeleton... surface (diaphragmatic surface of heart). |
| Lateral leads |
Green |
I, aVL, V5 and V6 |
Look at the electrical activity from the vantage point of the lateral wall of left ventricle In the heart, a ventricle is one of two large chambers that collect and expel blood received from an atrium towards the peripheral beds within the body and lungs. The Atria primes the Pump... .
- The positive electrode for leads I and aVL should be located distally on the left arm and because of which, leads I and aVL are sometimes referred to as the high lateral leads.
- Because the positive electrodes for leads V5 and V6 are on the patient's chest, they are sometimes referred to as the low lateral leads.
|
| Septal leads |
Orange |
V1 and V2 |
Look at electrical activity from the vantage point of the septal wall of the ventricles (interventricular septum Interventricular septum , abbreviated IVS, is the stout wall separating the lower chambers of the heart from one another.... ). |
| Anterior leads |
Blue |
V3 and V4 |
Look at electrical activity from the vantage point of the anterior surface of the heart (sternocostal surface of heart). |
In addition, any two precordial leads that are next to one another are considered to be contiguous. For example, even though V4 is an anterior lead and V5 is a lateral lead, they are contiguous because they are next to one another.

Lead aVR offers no specific view of the left ventricle. Rather, it views the inside of the endocardial wall to the surface of the right atrium, from its perspective on the right shoulder.
Filter selection
Modern ECG monitors offer multiple filters for signal processing. The most common settings are monitor mode and diagnostic mode. In monitor mode, the low frequency filter (also called the high-pass filterA high-pass filter is a device that passes high frequencies and attenuates frequencies lower than its cutoff frequency. A high-pass filter is usually modeled as a linear time-invariant system...
because signals above the threshold are allowed to pass) is set at either 0.5 Hz or 1 Hz and the high frequency filter (also called the low-pass filterA low-pass filter is an electronic filter that passes low-frequency signals but attenuates signals with frequencies higher than the cutoff frequency. The actual amount of attenuation for each frequency varies from filter to filter. It is sometimes called a high-cut filter, or treble cut filter...
because signals below the threshold are allowed to pass) is set at 40 Hz. This limits artifact for routine cardiac rhythm monitoring. The high-pass filter helps reduce wandering baseline and the low-pass filter helps reduce 50 or 60 Hz power line noise (the power line network frequency differs between 50 and 60 Hz in different countries). In diagnostic mode, the high-pass filter is set at 0.05 Hz, which allows accurate ST segments to be recorded. The low-pass filter is set to 40, 100, or 150 Hz. Consequently, the monitor mode ECG display is more filtered than diagnostic mode, because its passband is narrower.
Indications
Symptoms generally indicating use of electrocardiography include:
- Cardiac murmurs
- Syncope
In phonology, syncope is the loss of one or more sounds from the interior of a word; especially, the loss of an unstressed vowel. It is found bothin Synchronic analysis of languages and Diachronics .-Found synchronically:...
or collapse
- Seizure
An epileptic seizure, occasionally referred to as a fit, is defined as a transient symptom of "abnormal excessive or synchronous neuronal activity in the brain". The outward effect can be as dramatic as a wild thrashing movement or as mild as a brief loss of awareness...
s
- Perceived cardiac dysrhythmia
Cardiac dysrhythmia is any of a large and heterogeneous group of conditions in which there is abnormal electrical activity in the heart. The heart beat may be too fast or too slow, and may be regular or irregular.Some arrhythmias are life-threatening medical emergencies that can result in cardiac...
s
- Symptoms of myocardial infarction
Myocardial infarction or acute myocardial infarction , commonly known as a heart attack, results from the interruption of blood supply to a part of the heart, causing heart cells to die...
. See Electrocardiography in myocardial infarctionElectrocardiography in suspected myocardial infarction has the main purpose of detecting ischemia or acute coronary injury in emergency department populations coming for symptoms of myocardial infarction . Also, it can distinguish clinically different types of myocardial infarction.-Technical...
It is also used to assess patients with systemic disease as well as monitoring during anesthesiaAnesthesia, or anaesthesia , traditionally meant the condition of having sensation blocked or temporarily taken away...
and critically ill patients.
Some pathological entities which can be seen on the ECG
| Shortened QT interval |
Hypercalcemia, some drugs, certain genetic abnormalitiesShort QT syndrome is a genetic disease of the electrical system of the heart. It consists of a constellation of signs and symptoms, consisting of a short QT interval on an EKG that does not significantly change with heart rate, tall and peaked T waves, and a structurally normal heart... . |
| Prolonged QT interval |
Hypocalcemia, some drugs, certain genetic abnormalities The long QT syndrome is a rare inborn heart condition in which delayed repolarization of the heart following a heartbeat increases the risk of episodes of torsade de pointes . These episodes may lead to palpitations, fainting and sudden death due to ventricular fibrillation... . |
| Flattened or inverted T waves |
Coronary ischemia Coronary ischemia is a medical term for not having enough blood through the coronary arteries. Coronary ischemia is linked to heart disease as well as heart attacks.It is also known as cardiac ischemia.-Causes:... , hypokalemiaHypokalemia or hypokalaemia , also hypopotassemia or hypopotassaemia , refers to the condition in which the concentration of potassium in the blood is low... , left ventricular hypertrophyLeft ventricular hypertrophy is the thickening of the myocardium of the left ventricle of the heart.-Causes:While ventricular hypertrophy occurs naturally as a reaction to aerobic exercise and strength training, it is most frequently referred to as a pathological reaction to cardiovascular... , digoxinDigoxin INN , also known as digitalis, is a purified cardiac glycoside and extracted from the foxglove plant, Digitalis lanata. Its corresponding aglycone is digoxigenin, and its acetyl derivative is acetyldigoxin... effect, some drugs. |
| Hyperacute T waves |
Possibly the first manifestation of acute myocardial infarctionMyocardial infarction or acute myocardial infarction , commonly known as a heart attack, results from the interruption of blood supply to a part of the heart, causing heart cells to die... , where T waves become more prominent, symmetrical, and pointed. |
| Prominent U waves |
Hypokalemia Hypokalemia or hypokalaemia , also hypopotassemia or hypopotassaemia , refers to the condition in which the concentration of potassium in the blood is low... . |
Electrocardiogram heterogeneity
Electrocardiogram (ECG) heterogeneity is a measurement of the amount of varianceIn probability theory and statistics, the variance is a measure of how far a set of numbers is spread out. It is one of several descriptors of a probability distribution, describing how far the numbers lie from the mean . In particular, the variance is one of the moments of a distribution...
between one ECG waveformWaveform means the shape and form of a signal such as a wave moving in a physical medium or an abstract representation.In many cases the medium in which the wave is being propagated does not permit a direct visual image of the form. In these cases, the term 'waveform' refers to the shape of a graph...
and the next. This heterogeneity can be measured by placing multiple ECG electrodes on the chest and by then computing the variance in waveform morphologyThe shape of an object located in some space is a geometrical description of the part of that space occupied by the object, as determined by its external boundary – abstracting from location and orientation in space, size, and other properties such as colour, content, and material...
across the signals obtained from these electrodes. Recent research suggests that ECG heterogeneity often precedes dangerous cardiac arrhythmias.
In the future, implantable devices may be programmed to measure and track heterogeneity. These devices could potentially help ward off arrhythmias by stimulating nerves such as the vagus nerveThe vagus nerve , also called pneumogastric nerve or cranial nerve X, is the tenth of twelve paired cranial nerves...
, by delivering drugs such as beta-blockers, and if necessary, by defibrillatingDefibrillation is a common treatment for life-threatening cardiac arrhythmias, ventricular fibrillation and pulseless ventricular tachycardia. Defibrillation consists of delivering a therapeutic dose of electrical energy to the affected heart with a device called a defibrillator...
the heart.
See also
External links