

Diabetes management software
Encyclopedia
- test results from a glucose meterGlucose meterA glucose meter is a medical device for determining the approximate concentration of glucose in the blood. It is a key element of home blood glucose monitoring by people with diabetes mellitus or hypoglycemia...
- diabetes logbooks
- basalBasal (medicine)Basal when used in a medical sense refers to a minimal level that is necessary for health or life. As used by diabetics and health care professionals, it describes a low, continuous dosage of insulin intended to "cover" the glucose output of the liver.This works together with a bolus of insulin,...
and bolusBolus (medicine)In medicine, a bolus is the administration of a medication, drug or other compound that is given to raise its concentration in blood to an effective level...
settings for an insulin pumpInsulin pumpThe insulin pump is a medical device used for the administration of insulin in the treatment of diabetes mellitus, also known as continuous subcutaneous insulin infusion therapy.The device includes:... - records of actual insulin delivery
- records of carbohydrates eaten and bolused to cover
- statistical evaluation
- manual log entries for exercise, etc.
Features and uses
There are many products available to help maintain records and analyze trends related to diabetes care. Some support a single diabetes tool such as one manufacturers glucose meter, while others are intended to interface with many manufacturers products. Some diabetes management software is free to download or can be used on-line, while others are for sale (or shareware). Some are simple and easy to use for a single user, while others have very powerful features that support many users in a clinical setting. The emergence of user-friendly mobile devices has resulted in renewed interest in diabetes mobile applications, and there is a 2011 review article of the currently available features compared against evidence-based recommendations for diabetes self-management .Depending on the product selected, there are a variety of features which include:
- summary tables or diabetes logbook data that can be:
- imported from multiple sources,
- viewed on the screen,
- saved and archived for personal use,
- printed, faxed, or emailed to share with your diabetes care team.
- charts to analyze:
- visualization of repeating patterns,
- blood glucose trends for evaluation of
- compliance with goals, and
- consideration for new insulin adjustments,
- control screens for:
- insulin pump setup and control,
- continuous blood glucose monitoring setup and control.
Logbook
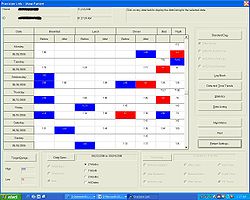
Example 1 shows a logbook can combine readings from multiple meters (such as one at home and another at work or school) in one place. Breakfast, lunch, and dinner readings are lined up vertically to help look for trends. The logbook automatically colors the box red for a low blood sugar, and blue for a high blood sugar. In the example chart, a pattern is easy to visualize: mornings tend to be a bit high (more insulin is needed at night) and there is a pattern of lows occurring after dinner (perhaps dinner insulin or the afternoon basal rates could be turned down).Standard day data plots
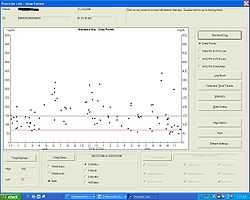
The Standard day data plots, see example 2, shows that trends are easy to see. The blood glucose readings are plotted at their level versus the time of day. Multiple days are plotted on top of each other, creating a scatter of points. In the example shown, it is easy to see the glycemic excursions to high blood sugars following breakfast and lunch. Once identified, this can be improved by using a faster acting insulin, or injecting insulin 20 minutes before eating, or by selecting carbohydrates to eat that are slower to peak in the bloodstream.Pie charts
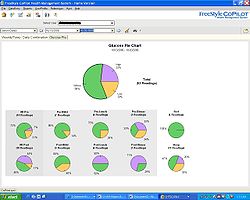
Example 3 shows that pie charts are a quick way to judge performance of insulin doses throughout the day relative to the goal of keeping 75% of premeal blood glucose readings within boundaries. Sub-charts automatically break down to breakfast, lunch, dinner, and late night, as well as show pre-meal versus post-meal statistics. In the example pie chart shown, it appears there is an opportunity to improve morning lows and afternoon highs with insulin adjustments.Daily views
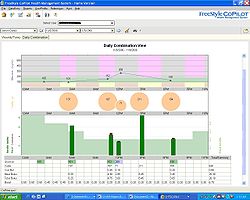
Example 4 evaluates the delivery from an insulin pumpInsulin pump
The insulin pump is a medical device used for the administration of insulin in the treatment of diabetes mellitus, also known as continuous subcutaneous insulin infusion therapy.The device includes:...
, showing blood glucose plots along the top, carbohydrates eaten (bubbles in the middle of the chart), basal and bolus insulin delivered at the bottom. This is a good example of the flexibility in lifestyle afforded to an insulin pump user as carbohydrates are not "scheduled" to match insulin profiles, and yet the glycemic excursions are well controlled. In this chart, it is also easy to see that the pump user had a meal at 3pm but forgot to test blood glucose beforehand.
Basal pattern control
Example 5 shows a control screen for basal delivery from an insulin pump. Time of day and basal rate in units per hour can be modified to create a custom basal rate pattern to match the insulin needs of the pump user. Icons are shown which save or read data from the PC, or to upload and download it from the pump.Bolus control
Example 6 shows bolus control on this screen. The insulin to carbohydrate ratio is stored in the pump as a function of the meal eaten (time of day). This screen selects grams of carbohydrate as the input parameter from the user, such that the pump can calculate the insulin bolus desired from the grams entered and the insulin to carb ratio that is stored.CGMS
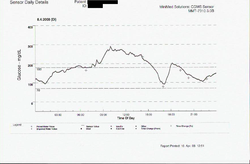
Example 7 shows a data plot from a continuous glucose monitoring system (CGMS). This plot shows the blood sugar levels between meals and also during the night, when other BG testing methods using a finger prick sample would typically miss the data available between samples. CGMS data is a new technology that it intended to give immediate feedback between finger sticks and also predict what may be hapenning soon to give the diabetic person a chance to correct a high or low blood sugar condition before it becomes urgent. This curve also illustrates the dawn effectDawn effect
Dawn phenomenon is defined as an increase in the blood sugar in the morning and is typically invoked in the context of diabetes. It is different from Chronic Somogyi rebound in that dawn effect is not associated with nocturnal hypoglycemia....
.
External links
- Free offers
- Commercial offers
- Open Source products
- GNU Glyco Control
- sugaR R package (plots for statistics suite, non-trivial data entry)
- Open Source Diabetes