

Cramér's V
Encyclopedia
 |
| Cramér's V (φc) |
|---|
In statistics
Statistics
Statistics is the study of the collection, organization, analysis, and interpretation of data. It deals with all aspects of this, including the planning of data collection in terms of the design of surveys and experiments....
, Cramér's V (sometimes referred to as Cramér's phi and denoted as φc) is a popular measure of association
Association (statistics)
In statistics, an association is any relationship between two measured quantities that renders them statistically dependent. The term "association" refers broadly to any such relationship, whereas the narrower term "correlation" refers to a linear relationship between two quantities.There are many...
between two nominal variables, giving a value between 0 and +1 (inclusive). It is based on Pearson's chi-squared statistic and was published by Harald Cramér
Harald Cramér
Harald Cramér was a Swedish mathematician, actuary, and statistician, specializing in mathematical statistics and probabilistic number theory. He was once described by John Kingman as "one of the giants of statistical theory".-Early life:Harald Cramér was born in Stockholm, Sweden on September...
in 1946
Usage and interpretation
φc is the intercorrelation of two discrete variables and may be used with variables having two or more levels. φc is a symmetrical measure, it does not matter which variable we place in the columns and which in the rows. Also, the order of rows/columns doesn't matter, so φc may be used with nominal data types or higher (ordered, numerical, etc)Cramér's V may also be applied to goodness of fit
Goodness of fit
The goodness of fit of a statistical model describes how well it fits a set of observations. Measures of goodness of fit typically summarize the discrepancy between observed values and the values expected under the model in question. Such measures can be used in statistical hypothesis testing, e.g...
chi-squared models when there is a 1×k table (e.g: r=1). In this case k is taken as the number of optional outcomes and it functions as a measure of tendency towards a single outcome.
Cramér's V varies from 0 (corresponding to no association between the variables) to 1 (complete association) and can reach 1 only when the two variables are equal to each other.
φc2 is the mean square canonical correlation
Canonical correlation
In statistics, canonical correlation analysis, introduced by Harold Hotelling, is a way of making sense of cross-covariance matrices. If we have two sets of variables, x_1, \dots, x_n and y_1, \dots, y_m, and there are correlations among the variables, then canonical correlation analysis will...
between the variables.
In the case of a 2×2 contingency table
Contingency table
In statistics, a contingency table is a type of table in a matrix format that displays the frequency distribution of the variables...
Cramér's V is equal to the Phi coefficient
Phi coefficient
In statistics, the phi coefficient is a measure of association for two binary variables introduced by Karl Pearson. This measure is similar to the Pearson correlation coefficient in its interpretation...
.
Note that as chi-squared values tend to increase with the number of cells, the greater the difference between r (rows) and c (columns), the more likely φc will tend to 1 without strong evidence of a meaningful correlation.
Calculation
Cramér's V is computed by taking the square root of the chi-squared statistic divided by the sample size and the length of the minimum dimension (k is the smaller of the number of rows r or columns c).The formula for the φc coefficient is:
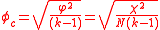
where:
-
 is the phi coefficientPhi coefficientIn statistics, the phi coefficient is a measure of association for two binary variables introduced by Karl Pearson. This measure is similar to the Pearson correlation coefficient in its interpretation...
. -
 is derived from Pearson's chi-squared testPearson's chi-squared testPearson's chi-squared test is the best-known of several chi-squared tests – statistical procedures whose results are evaluated by reference to the chi-squared distribution. Its properties were first investigated by Karl Pearson in 1900...
 -
 is the grand total of observations and
 -
 being the number of rows or the number of columns, whichever is less.
The p-value
P-value
In statistical significance testing, the p-value is the probability of obtaining a test statistic at least as extreme as the one that was actually observed, assuming that the null hypothesis is true. One often "rejects the null hypothesis" when the p-value is less than the significance level α ,...
for the significance
Statistical significance
In statistics, a result is called statistically significant if it is unlikely to have occurred by chance. The phrase test of significance was coined by Ronald Fisher....
of φc is the same one that is calculated using the Pearson's chi-squared test
Pearson's chi-squared test
Pearson's chi-squared test is the best-known of several chi-squared tests – statistical procedures whose results are evaluated by reference to the chi-squared distribution. Its properties were first investigated by Karl Pearson in 1900...
.
The formula for the variance of φc is known.
See also
Other measures of correlation for nominal data:- The phi coefficientPhi coefficientIn statistics, the phi coefficient is a measure of association for two binary variables introduced by Karl Pearson. This measure is similar to the Pearson correlation coefficient in its interpretation...
- Tschuprow's TTschuprow's TIn statistics, Tschuprow's T is a measure of association between two nominal variables, giving a value between 0 and 1 . It is closely related to Cramér's V, coinciding with it for square contingency tables....
- The uncertainty coefficientUncertainty coefficientIn statistics, the uncertainty coefficient, also called entropy coefficient or Theil's U, is a measure of nominal association. It was first introduced by Henri Theil and is based on the concept of information entropy. Suppose we have samples of two random variables, i and j...
- The Lambda coefficient
Other related articles:
- Contingency tableContingency tableIn statistics, a contingency table is a type of table in a matrix format that displays the frequency distribution of the variables...
- Effect sizeEffect sizeIn statistics, an effect size is a measure of the strength of the relationship between two variables in a statistical population, or a sample-based estimate of that quantity...
External links
- A Measure of Association for Nonparametric Statistics (Alan C. Acock and Gordon R. Stavig Page 1381 of 1381–1386)
- Nominal Association: Phi, Contingency Coefficient, Tschuprow's T, Cramer's V, Lambda, Uncertainty Coefficient