

Cohen's class distribution function
Encyclopedia
Bilinear time–frequency distributions, or quadratic time–frequency distributions, arise in a sub-field field of signal analysis and signal processing
called time–frequency signal processing, and, in the statistical analysis of time series
data. Such methods are used where one needs to deal with a situation where the frequency composition of a signal may be changing over time; this sub-field used to be called time–frequency signal analysis, and is now more often called time–frequency signal processing due to the progress in using these methods to a wide range of signal-processing problems.
or the frequency domain
. A mixed approach is required in time–frequency analysis techniques which are especially effective in analyzing non-stationary signals, whose frequency distribution and magnitude vary with time. Examples of these are acoustic
signals. Classes of "quadratic time-frequency distributions" (or bilinear time–frequency distributions") are used for time–frequency signal analysis. This class is similar in formulation to Cohen's class distribution function that was used in 1966 in the context of quantum mechanics. This distribution function
is mathematically similar to a generalized time–frequency representation which utilizes bilinear transformations. Compared with other time–frequency analysis techniques, such as short-time Fourier transform
(STFT), the bilinear-transformation (or quadratic time–frequency distributions) may not have higher clarity for most practical signals, but it provides an alternative framework to investigate new definitions and new methods. While it does suffer from an inherent cross-term contamination when analyzing multi-component signals, by using a carefully chosen window function
s, the interference can be significantly mitigated, at the expense of resolution.

where is the ambiguity function (AF) which will be further discussed later, and
  is the kernel function which is usually a low-pass function and is used to mask out the interference.
Consider the well known power spectral density and the signal auto-correlation function
  in the case of a stationary process. The relationship between these functions is as follows:

For a non-stationary signal , these relations can be generalized using a time-dependent power spectral density or equivalently the famous Wigner distribution function
of as follows:

If the Fourier transform
of the auto-correlation function is taken with respect to instead of
  , we get the ambiguity function as follows:

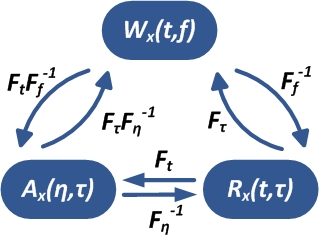
The relationship between the Wigner distribution function, the auto-correlation function and the ambiguity function can then be illustrated by the following figure.
 By comparing the definition of bilinear (or quadratic) time–frequency distributions with that of the Wigner distribution function, it is easily found that the latter is a special case of the former with
  . Alternatively, bilinear (or quadratic) time–frequency distributions can be regarded as a masked version of the Wigner distribution function if a kernel function
  is chosen. A properly chosen kernel function can significantly reduce the undesirable cross-term of the Wigner distribution function.
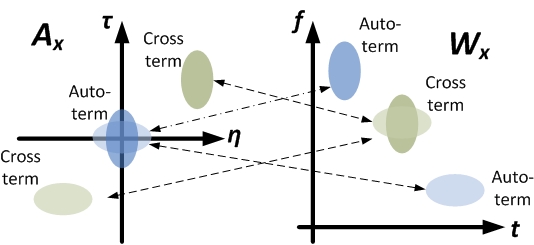
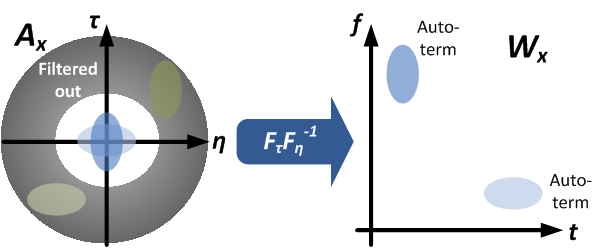
What is the benefit of the additional kernel function? The following figure shows the distribution of the auto-term and the cross-term of a multi-component signal in both the ambiguity and the Wigner distribution function.
 For multi-component signals in general, the distribution of its auto-term and cross-term within its Wigner distribution
function is generally not predictable, and hence the cross-term cannot be removed easily. However, as shown in the figure, for the ambiguity function, the auto-term of the multi-component signal will inherently tend to close the origin in the plane, and the cross-term will tend to be away from the origin. With this property, the cross-term in can be filtered out effortlessly if a proper low-pass kernel function is applied in
  domain. The following is an example that demonstrates how the cross-term is filtered out.
 . The definition of Wigner distribution is as follows:

where α is an adjustable parameter.
where is an adjustable parameter. See Transformation between distributions in time-frequency analysis
.
More such QTFDs and a full list can be found in, e.g., Cohen's text cited.
Signal processing
Signal processing is an area of systems engineering, electrical engineering and applied mathematics that deals with operations on or analysis of signals, in either discrete or continuous time...
called time–frequency signal processing, and, in the statistical analysis of time series
Time series
In statistics, signal processing, econometrics and mathematical finance, a time series is a sequence of data points, measured typically at successive times spaced at uniform time intervals. Examples of time series are the daily closing value of the Dow Jones index or the annual flow volume of the...
data. Such methods are used where one needs to deal with a situation where the frequency composition of a signal may be changing over time; this sub-field used to be called time–frequency signal analysis, and is now more often called time–frequency signal processing due to the progress in using these methods to a wide range of signal-processing problems.
Background
Methods for analysing time series, in both signal analysis and time series analysis, have been developed as essentially separate methodologies applicable to, and based in, either the timeTime domain
Time domain is a term used to describe the analysis of mathematical functions, physical signals or time series of economic or environmental data, with respect to time. In the time domain, the signal or function's value is known for all real numbers, for the case of continuous time, or at various...
or the frequency domain
Frequency domain
In electronics, control systems engineering, and statistics, frequency domain is a term used to describe the domain for analysis of mathematical functions or signals with respect to frequency, rather than time....
. A mixed approach is required in time–frequency analysis techniques which are especially effective in analyzing non-stationary signals, whose frequency distribution and magnitude vary with time. Examples of these are acoustic
Acoustics
Acoustics is the interdisciplinary science that deals with the study of all mechanical waves in gases, liquids, and solids including vibration, sound, ultrasound and infrasound. A scientist who works in the field of acoustics is an acoustician while someone working in the field of acoustics...
signals. Classes of "quadratic time-frequency distributions" (or bilinear time–frequency distributions") are used for time–frequency signal analysis. This class is similar in formulation to Cohen's class distribution function that was used in 1966 in the context of quantum mechanics. This distribution function
Distribution function
In molecular kinetic theory in physics, a particle's distribution function is a function of seven variables, f, which gives the number of particles per unit volume in phase space. It is the number of particles per unit volume having approximately the velocity near the place and time...
is mathematically similar to a generalized time–frequency representation which utilizes bilinear transformations. Compared with other time–frequency analysis techniques, such as short-time Fourier transform
Short-time Fourier transform
The short-time Fourier transform , or alternatively short-term Fourier transform, is a Fourier-related transform used to determine the sinusoidal frequency and phase content of local sections of a signal as it changes over time....
(STFT), the bilinear-transformation (or quadratic time–frequency distributions) may not have higher clarity for most practical signals, but it provides an alternative framework to investigate new definitions and new methods. While it does suffer from an inherent cross-term contamination when analyzing multi-component signals, by using a carefully chosen window function
Window function
In signal processing, a window function is a mathematical function that is zero-valued outside of some chosen interval. For instance, a function that is constant inside the interval and zero elsewhere is called a rectangular window, which describes the shape of its graphical representation...
s, the interference can be significantly mitigated, at the expense of resolution.
Mathematical definition
The definition of the class of bilinear (or quadratic) time–frequency distributions is as follows:where
is the ambiguity function (AF) which will be further discussed later, and is the kernel function which is usually a low-pass function and is used to mask out the interference.Ambiguity function
The class of bilinear (or quadratic) time–frequency distributions can be most easily understood in terms of the ambiguity function an explanation of which follows.Consider the well known power spectral density
and the signal auto-correlation function in the case of a stationary process. The relationship between these functions is as follows:For a non-stationary signal
, these relations can be generalized using a time-dependent power spectral density or equivalently the famous Wigner distribution functionWigner distribution function
The Wigner distribution function was first proposed to account for quantum corrections to classical statistical mechanics in 1932 by Eugene Wigner, cf. Wigner quasi-probability distribution....
of
as follows:If the Fourier transform
Fourier transform
In mathematics, Fourier analysis is a subject area which grew from the study of Fourier series. The subject began with the study of the way general functions may be represented by sums of simpler trigonometric functions...
of the auto-correlation function is taken with respect to
instead of , we get the ambiguity function as follows:The relationship between the Wigner distribution function, the auto-correlation function and the ambiguity function can then be illustrated by the following figure.
. Alternatively, bilinear (or quadratic) time–frequency distributions can be regarded as a masked version of the Wigner distribution function if a kernel function is chosen. A properly chosen kernel function can significantly reduce the undesirable cross-term of the Wigner distribution function.What is the benefit of the additional kernel function? The following figure shows the distribution of the auto-term and the cross-term of a multi-component signal in both the ambiguity and the Wigner distribution function.
function is generally not predictable, and hence the cross-term cannot be removed easily. However, as shown in the figure, for the ambiguity function, the auto-term of the multi-component signal will inherently tend to close the origin in the
plane, and the cross-term will tend to be away from the origin. With this property, the cross-term in can be filtered out effortlessly if a proper low-pass kernel function is applied in domain. The following is an example that demonstrates how the cross-term is filtered out.Wigner distribution function
Aforementioned, the Wigner distribution function is a member of the class of quadratic time-frequency distributions (QTFDs)with the kernel function. The definition of Wigner distribution is as follows:Choi–Williams distribution function
The kernel of Choi–Williams distribution is defined as follows:where α is an adjustable parameter.
Cone-shape distribution function
The kernel of cone-shape distribution function is defined as follows:where
is an adjustable parameter. See Transformation between distributions in time-frequency analysisTransformation between distributions in time-frequency analysis
In the field of time–frequency analysis, the goal is to define signal formulations that are used for representing the signal in a joint time–frequency domain . There are several methods and transforms called "time-frequency distributions"...
.
More such QTFDs and a full list can be found in, e.g., Cohen's text cited.