
Carpet plot
Encyclopedia
A carpet plot is any of a few different specific types of diagram.
Named for its common application within areas such as material science for showing elastic modulus
in laminates, and within aeronautics
.
Each occurrence is registered in a Cartesian coordinate system, in which both axes show time, have different time resolutions: one axis shows slices of data, the other some sensible interval. A common example would be that one axis shows hours in a day, the other days in a year.
In a 2D plot, the value to be plotted is coded with an intensity or a color. In the 3D variant of the plot, it is often coded as a height. When visualized, particularly the color-coded variant of the plot may easily show a carpet
-like pattern.
Carpet plots make it easy to show time-based relations within a large sets of time-interval data and often make it easy to recognize local maxima and minima
. Assuming the chosen time division is related to the events, it is also easy to recognize global and local patterns, such as recurrent events.
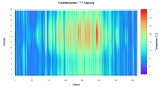
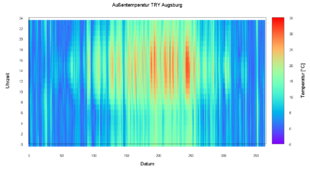 In the following example, the data is one year's worth of measurements of the outdoor temperatures in Augsburg
, with four samples taken per hour. In the according carpet diagram, each column represents a day in the year and contains the values for that day (from 0:00 until 23:45).
Despite the high number of measure points (about 35000) it is easy to disdistinguish local and global patterns.
Note the similarity to beat graphs as described by Werner Van Belle.
Interaction of two independent variables
Probably the more common plot referred to as a carpet plot is one that illustrates the interacting behaviour of two independent variables, which among other things facilitates interpolation in both variables at once.Named for its common application within areas such as material science for showing elastic modulus
Elastic modulus
An elastic modulus, or modulus of elasticity, is the mathematical description of an object or substance's tendency to be deformed elastically when a force is applied to it...
in laminates, and within aeronautics
Aeronautics
Aeronautics is the science involved with the study, design, and manufacturing of airflight-capable machines, or the techniques of operating aircraft and rocketry within the atmosphere...
.
Temporal raster plots
Another visualization that is sometimes called a carpet plot is a graphic representation of occurrences in a certain temporal relation.Each occurrence is registered in a Cartesian coordinate system, in which both axes show time, have different time resolutions: one axis shows slices of data, the other some sensible interval. A common example would be that one axis shows hours in a day, the other days in a year.
In a 2D plot, the value to be plotted is coded with an intensity or a color. In the 3D variant of the plot, it is often coded as a height. When visualized, particularly the color-coded variant of the plot may easily show a carpet
Carpet
A carpet is a textile floor covering consisting of an upper layer of "pile" attached to a backing. The pile is generally either made from wool or a manmade fibre such as polypropylene,nylon or polyester and usually consists of twisted tufts which are often heat-treated to maintain their...
-like pattern.
Carpet plots make it easy to show time-based relations within a large sets of time-interval data and often make it easy to recognize local maxima and minima
Maxima and minima
In mathematics, the maximum and minimum of a function, known collectively as extrema , are the largest and smallest value that the function takes at a point either within a given neighborhood or on the function domain in its entirety .More generally, the...
. Assuming the chosen time division is related to the events, it is also easy to recognize global and local patterns, such as recurrent events.
Augsburg
Augsburg is a city in the south-west of Bavaria, Germany. It is a university town and home of the Regierungsbezirk Schwaben and the Bezirk Schwaben. Augsburg is an urban district and home to the institutions of the Landkreis Augsburg. It is, as of 2008, the third-largest city in Bavaria with a...
, with four samples taken per hour. In the according carpet diagram, each column represents a day in the year and contains the values for that day (from 0:00 until 23:45).
Despite the high number of measure points (about 35000) it is easy to disdistinguish local and global patterns.
Note the similarity to beat graphs as described by Werner Van Belle.