

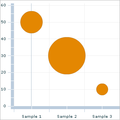
Bubble chart
Encyclopedia
Chart
A chart is a graphical representation of data, in which "the data is represented by symbols, such as bars in a bar chart, lines in a line chart, or slices in a pie chart"...
where each plotted entity is defined in terms of three distinct numeric parameters. Bubble charts can facilitate the understanding of the social, economical, medical, and other scientific relationships.
Overview
The entities displayed on a bubble chart can be compared in terms of their size as well as their relative positions with respect to each numeric axis. Since both X and Y axis of the bubble chart are numeric scales, the position of plot is an indicator of two distinct numeric values. The areaArea
Area is a quantity that expresses the extent of a two-dimensional surface or shape in the plane. Area can be understood as the amount of material with a given thickness that would be necessary to fashion a model of the shape, or the amount of paint necessary to cover the surface with a single coat...
of the plot depends on the magnitude of a third numeric characteristic. One concern when rendering data with a bubble chart is that the area of a circle is proportional to the square of the radius. So if you scale the radius with your third data point, you will disproportionally emphasize the third factor. To get a properly weighted scale, one should take the square root of the magnitude of this third metric. However, many bubble charts are rendered without this correction.
A bubble chart can be considered a "variation of a scatter plot, in which the data points are replaced with bubbles. This type of chart can be used instead of a Scatter chart if your data has three data series, each of which contains a set of values".
Bubble charts, according to Berman (2007), can "be used in project management
Project management
Project management is the discipline of planning, organizing, securing, and managing resources to achieve specific goals. A project is a temporary endeavor with a defined beginning and end , undertaken to meet unique goals and objectives, typically to bring about beneficial change or added value...
to compare the risk and reward among projects. In a chart each project can be respresented by a bubble,the axis can represent the net present value and probability of success and the size of the bubble can represent the overall cost of the project".
In architecture
Architecture
Architecture is both the process and product of planning, designing and construction. Architectural works, in the material form of buildings, are often perceived as cultural and political symbols and as works of art...
a first architectural sketch
Sketch (drawing)
A sketch is a rapidly executed freehand drawing that is not usually intended as a finished work...
of the lay out constructed with bubbles is also named a "bubble chart".
In software engineering
Software engineering
Software Engineering is the application of a systematic, disciplined, quantifiable approach to the development, operation, and maintenance of software, and the study of these approaches; that is, the application of engineering to software...
a bubble chart is defined as a data flow
Data flow diagram
A data flow diagram is a graphical representation of the "flow" of data through an information system, modelling its process aspects. Often they are a preliminary step used to create an overview of the system which can later be elaborated...
, a data structure
Data structure
In computer science, a data structure is a particular way of storing and organizing data in a computer so that it can be used efficiently.Different kinds of data structures are suited to different kinds of applications, and some are highly specialized to specific tasks...
or other diagram in which entires are depicted with circles or bubbles and relationships are represented by links drawn between the circles.
Example
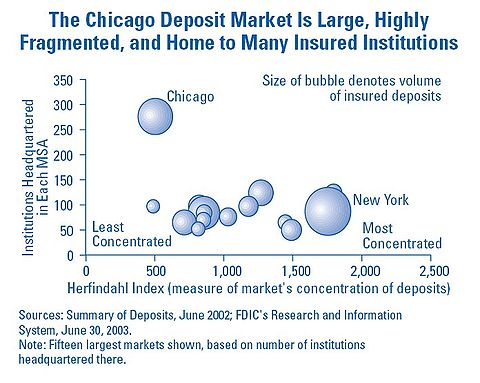
Bubble chart of the Chicago Deposit market 2003 in compare to other cities, which was highly fragmented and is not dominated by a small group of financial institutions, as is the case in many other markets.
External links
- Creating a Bubble chart Microsoft Office Online
- Scatter & Bubble chart example at amcharts.com
- The FusionCharts Blog
- Google's Motion Chart