

Yield curve
Encyclopedia
Finance
"Finance" is often defined simply as the management of money or “funds” management Modern finance, however, is a family of business activity that includes the origination, marketing, and management of cash and money surrogates through a variety of capital accounts, instruments, and markets created...
, the yield curve is the relation between the (level of) interest rate
Interest rate
An interest rate is the rate at which interest is paid by a borrower for the use of money that they borrow from a lender. For example, a small company borrows capital from a bank to buy new assets for their business, and in return the lender receives interest at a predetermined interest rate for...
(or cost of borrowing) and the time to maturity
Maturity (finance)
In finance, maturity or maturity date refers to the final payment date of a loan or other financial instrument, at which point the principal is due to be paid....
, known as the "term", of the debt for a given borrower in a given currency
Currency
In economics, currency refers to a generally accepted medium of exchange. These are usually the coins and banknotes of a particular government, which comprise the physical aspects of a nation's money supply...
. For example, the U.S. dollar
Dollar
The dollar is the name of the official currency of many countries, including Australia, Belize, Canada, Ecuador, El Salvador, Hong Kong, New Zealand, Singapore, Taiwan, and the United States.-Etymology:...
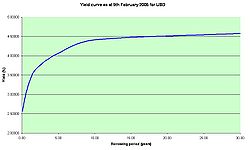
interest rates paid on U.S. Treasury securities for various maturities are closely watched by many traders, and are commonly plotted on a graph such as the one on the right which is informally called "the yield curve." More formal mathematical descriptions of this relation are often called the term structure of interest rates.
The yield
Yield (finance)
In finance, the term yield describes the amount in cash that returns to the owners of a security. Normally it does not include the price variations, at the difference of the total return...
of a debt
Debt
A debt is an obligation owed by one party to a second party, the creditor; usually this refers to assets granted by the creditor to the debtor, but the term can also be used metaphorically to cover moral obligations and other interactions not based on economic value.A debt is created when a...
instrument is the overall rate of return available on the investment. For instance, a bank account that pays an interest rate
Interest rate
An interest rate is the rate at which interest is paid by a borrower for the use of money that they borrow from a lender. For example, a small company borrows capital from a bank to buy new assets for their business, and in return the lender receives interest at a predetermined interest rate for...
of 4% per year has a 4% yield, when the price of the bond equals its par value. In general the percentage per year that can be earned is dependent on the length of time that the money is invested. For example, a bank may offer a "savings rate" higher than the normal checking account rate if the customer is prepared to leave money untouched for five years. Investing for a period of time t gives a yield Y(t).
This function
Function (mathematics)
In mathematics, a function associates one quantity, the argument of the function, also known as the input, with another quantity, the value of the function, also known as the output. A function assigns exactly one output to each input. The argument and the value may be real numbers, but they can...
Y is called the yield curve, and it is often, but not always, an increasing function of t. Yield curves are used by fixed income
Fixed income
Fixed income refers to any type of investment that is not equity, which obligates the borrower/issuer to make payments on a fixed schedule, even if the number of the payments may be variable....
analysts, who analyze bonds
Bond (finance)
In finance, a bond is a debt security, in which the authorized issuer owes the holders a debt and, depending on the terms of the bond, is obliged to pay interest to use and/or to repay the principal at a later date, termed maturity...
and related securities, to understand conditions in financial markets and to seek trading opportunities. Economist
Economist
An economist is a professional in the social science discipline of economics. The individual may also study, develop, and apply theories and concepts from economics and write about economic policy...
s use the curves to understand economic conditions.
The yield curve function Y is actually only known with certainty for a few specific maturity dates, while the other maturities are calculated by interpolation
Interpolation
In the mathematical field of numerical analysis, interpolation is a method of constructing new data points within the range of a discrete set of known data points....
(see Construction of the full yield curve from market data below).
The typical shape of the yield curve
Arbitrage pricing theory
In finance, arbitrage pricing theory is a general theory of asset pricing that holds that the expected return of a financial asset can be modeled as a linear function of various macro-economic factors or theoretical market indices, where sensitivity to changes in each factor is represented by a...
, investors who are willing to lock their money in now need to be compensated for the anticipated rise in rates—thus the higher interest rate on long-term investments.
Another explanation is that longer maturities entail greater risks for the investor (i.e. the lender). A risk premium
Risk premium
A risk premium is the minimum amount of money by which the expected return on a risky asset must exceed the known return on a risk-free asset, in order to induce an individual to hold the risky asset rather than the risk-free asset...
is needed by the market, since at longer durations there is more uncertainty and a greater chance of catastrophic events that impact the investment. This explanation depends on the notion that the economy faces more uncertainties in the distant future than in the near term. This effect is referred to as the liquidity spread. If the market expects more volatility in the future, even if interest rates are anticipated to decline, the increase in the risk premium can influence the spread and cause an increasing yield.
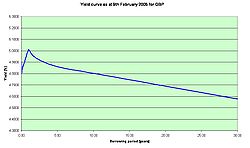
The opposite position (short-term interest rates higher than long-term) can also occur. For instance, in November 2004, the yield curve for UK Government bonds
Gilts
Gilts are bonds issued by certain national governments. The term is of British origin, and originally referred to the debt securities issued by the Bank of England, which had a gilt edge. Hence, they are called gilt-edged securities, or gilts for short. The term is also sometimes used in Ireland...
was partially inverted. The yield for the 10 year bond stood at 4.68%, but was only 4.45% for the 30 year bond. The market's anticipation of falling interest rates causes such incidents. Negative liquidity premium
Liquidity premium
Liquidity premium is a term used to explain a difference between two types of financial securities , that have all the same qualities except liquidity. For example:...
s can also exist if long-term investors dominate the market, but the prevailing view is that a positive liquidity premium dominates, so only the anticipation of falling interest rates will cause an inverted yield curve. Strongly inverted yield curves have historically preceded economic depressions.
The shape of the yield curve is influenced by supply and demand
Supply and demand
Supply and demand is an economic model of price determination in a market. It concludes that in a competitive market, the unit price for a particular good will vary until it settles at a point where the quantity demanded by consumers will equal the quantity supplied by producers , resulting in an...
: for instance, if there is a large demand for long bonds, for instance from pension funds to match their fixed liabilities to pensioners, and not enough bonds in existence to meet this demand, then the yields on long bonds can be expected to be low, irrespective of market participants' views about future events.
The yield curve may also be flat or hump-shaped, due to anticipated interest rates being steady, or short-term volatility outweighing long-term volatility.
Yield curves continually move all the time that the markets are open, reflecting the market's reaction to news. A further "stylized fact" is that yield curves tend to move in parallel (i.e., the yield curve shifts up and down as interest rate levels rise and fall).
Types of yield curve
There is no single yield curve describing the cost of money for everybody. The most important factor in determining a yield curve is the currency in which the securities are denominated. The economic position of the countries and companies using each currency is a primary factor in determining the yield curve. Different institutions borrow money at different rates, depending on their creditworthiness. The yield curves corresponding to the bonds issued by governments in their own currency are called the government bond yield curve (government curve). Banks with high credit ratingsBond credit rating
In investment, the bond credit rating assesses the credit worthiness of a corporation's or government debt issues. It is analogous to credit ratings for individuals.-Table:...
(Aa/AA or above) borrow money from each other at the LIBOR rates. These yield curves are typically a little higher than government curves. They are the most important and widely used in the financial markets, and are known variously as the LIBOR curve or the swap
Swap (finance)
In finance, a swap is a derivative in which counterparties exchange certain benefits of one party's financial instrument for those of the other party's financial instrument. The benefits in question depend on the type of financial instruments involved...
curve. The construction of the swap curve is described below.
Besides the government curve and the LIBOR curve, there are corporate
Corporation
A corporation is created under the laws of a state as a separate legal entity that has privileges and liabilities that are distinct from those of its members. There are many different forms of corporations, most of which are used to conduct business. Early corporations were established by charter...
(company) curves. These are constructed from the yields of bonds issued by corporations. Since corporations have less creditworthiness than most governments and most large banks, these yields are typically higher. Corporate yield curves are often quoted in terms of a "credit spread" over the relevant swap curve. For instance the five-year yield curve point for Vodafone
Vodafone
Vodafone Group Plc is a global telecommunications company headquartered in London, United Kingdom. It is the world's largest mobile telecommunications company measured by revenues and the world's second-largest measured by subscribers , with around 341 million proportionate subscribers as of...
might be quoted as LIBOR +0.25%, where 0.25% (often written as 25 basis point
Basis point
A basis point is a unit equal to 1/100 of a percentage point or one part per ten thousand...
s or 25bps) is the credit spread.
Normal yield curve
From the post-Great DepressionGreat Depression
The Great Depression was a severe worldwide economic depression in the decade preceding World War II. The timing of the Great Depression varied across nations, but in most countries it started in about 1929 and lasted until the late 1930s or early 1940s...
era to the present, the yield curve has usually been "normal" meaning that yields rise as maturity lengthens (i.e., the slope of the yield curve is positive). This positive slope reflects investor expectations for the economy to grow in the future and, importantly, for this growth to be associated with a greater expectation that inflation will rise in the future rather than fall. This expectation of higher inflation leads to expectations that the central bank
Central bank
A central bank, reserve bank, or monetary authority is a public institution that usually issues the currency, regulates the money supply, and controls the interest rates in a country. Central banks often also oversee the commercial banking system of their respective countries...
will tighten monetary policy by raising short term interest rates in the future to slow economic growth and dampen inflationary pressure. It also creates a need for a risk premium associated with the uncertainty about the future rate of inflation and the risk this poses to the future value of cash flows. Investors price these risks into the yield curve by demanding higher yields for maturities further into the future. In a positively sloped yield curve, lenders profit from the passage of time since yields decrease as bonds get closer to maturity (as yield decreases, price increases); this is known as rolldown and is a significant component of profit in fixed-income investing (i.e., buying and selling, not necessarily holding to maturity), particularly if the investing is leveraged
Leverage (finance)
In finance, leverage is a general term for any technique to multiply gains and losses. Common ways to attain leverage are borrowing money, buying fixed assets and using derivatives. Important examples are:* A public corporation may leverage its equity by borrowing money...
.
However, a positively sloped yield curve has not always been the norm. Through much of the 19th century and early 20th century the US economy experienced trend growth with persistent deflation, not inflation. During this period the yield curve was typically inverted, reflecting the fact that deflation made current cash flows less valuable than future cash flows. During this period of persistent deflation, a 'normal' yield curve was negatively sloped.
Steep yield curve
Historically, the 20-year Treasury bond yield has averaged approximately two percentage points above that of three-month Treasury bills. In situations when this gap increases (e.g. 20-year Treasury yield rises higher than the three-month Treasury yield), the economy is expected to improve quickly in the future. This type of curve can be seen at the beginning of an economic expansion (or after the end of a recession). Here, economic stagnation will have depressed short-term interest rates; however, rates begin to rise once the demand for capital is re-established by growing economic activity.In January 2010, the gap between yields on two-year Treasury notes and 10-year notes widened to 2.92 percentage points, its highest ever.
Flat or humped yield curve
A flat yield curve is observed when all maturities have similar yields, whereas a humped curve results when short-term and long-term yields are equal and medium-term yields are higher than those of the short-term and long-term. A flat curve sends signals of uncertainty in the economy. This mixed signal can revert to a normal curve or could later result into an inverted curve. It cannot be explained by the Segmented Market theory discussed below.Inverted yield curve
An inverted yield curve occurs when long-term yields fall below short-term yields. Under unusual circumstances, long-term investors will settle for lower yields now if they think the economy will slow or even decline in the future. Campbell R. Harvey's 1986 dissertation showed that an inverted yield curve accurately forecasts U.S. recessions. An inverted curve has indicated a worsening economic situation in the future 6 out of 7 times since 1970. The New York Federal Reserve regards it as a valuable forecasting tool in predicting recessions two to six quarters ahead. In addition to potentially signaling an economic decline, inverted yield curves also imply that the market believes inflation will remain low. This is because, even if there is a recession, a low bond yield will still be offset by low inflation. However, technical factors, such as a flight to quality or global economic or currency situations, may cause an increase in demand for bonds on the long end of the yield curve, causing long-term rates to fall.Since the Great Financial Crisis of 2007-2008, the U. S. Federal Reserve has maintained a ZIRP (zero interest rate policy) for an "extended period of time", where the short term interest rate is practically set to zero. Under this circumstance the nominal yield curve is unlikely to be inverted even in the event of a recession. Thus the absence of an inverted yield curve is not a sufficient condition to preclude recessions.
Theory
There are three main economic theories attempting to explain how yields vary with maturity. Two of the theories are extreme positions, while the third attempts to find a middle ground between the former two.Market expectations (pure expectations) hypothesis

This hypothesis
Hypothesis
A hypothesis is a proposed explanation for a phenomenon. The term derives from the Greek, ὑποτιθέναι – hypotithenai meaning "to put under" or "to suppose". For a hypothesis to be put forward as a scientific hypothesis, the scientific method requires that one can test it...
assumes that the various maturities are perfect substitutes
Substitute good
In economics, one way we classify goods is by examining the relationship of the demand schedules when the price of one good changes. This relationship between demand schedules leads economists to classify goods as either substitutes or complements. Substitute goods are goods which, as a result...
and suggests that the shape of the yield curve depends on market participants' expectations of future interest rates. These expected rates, along with an assumption that arbitrage
Arbitrage
In economics and finance, arbitrage is the practice of taking advantage of a price difference between two or more markets: striking a combination of matching deals that capitalize upon the imbalance, the profit being the difference between the market prices...
opportunities will be minimal, is enough information to construct a complete yield curve. For example, if investors have an expectation of what 1-year interest rates will be next year, the 2-year interest rate can be calculated as the compounding of this year's interest rate by next year's interest rate. More generally, rates on a long-term instrument are equal to the geometric mean
Geometric mean
The geometric mean, in mathematics, is a type of mean or average, which indicates the central tendency or typical value of a set of numbers. It is similar to the arithmetic mean, except that the numbers are multiplied and then the nth root of the resulting product is taken.For instance, the...
of the yield on a series of short-term instruments. This theory perfectly explains the observation that yields usually move together. However, it fails to explain the persistence in the shape of the yield curve.
Shortcomings of expectations theory:
Neglects the risks inherent in investing in bonds (because forward rates are not perfect predictors of future rates).
1) Interest rate risk
Interest rate risk
Interest rate risk is the risk borne by an interest-bearing asset, such as a loan or a bond, due to variability of interest rates. In general, as rates rise, the price of a fixed rate bond will fall, and vice versa...
2) Reinvestment rate risk
Liquidity premium theory
The Liquidity Premium Theory is an offshoot of the Pure Expectations Theory. The Liquidity Premium Theory asserts that long-term interest rates not only reflect investors’ assumptions about future interest rates but also include a premium for holding long-term bonds (investors prefer short term bonds to long term bonds), called the term premium or the liquidity premium. This premium compensates investors for the added risk of having their money tied up for a longer period, including the greater price uncertainty. Because of the term premium, long-term bond yields tend to be higher than short-term yields, and the yield curve slopes upward. Long term yields are also higher not just because of the liquidity premium, but also because of the risk premium added by the risk of default from holding a security over the long term. The market expectations hypothesis is combined with the liquidity premium theory:
Where
 is the risk premium associated with an
  year bond.
Market segmentation theory
This theory is also called the segmented market hypothesis. In this theory, financial instruments of different terms are not substitutableSubstitute good
In economics, one way we classify goods is by examining the relationship of the demand schedules when the price of one good changes. This relationship between demand schedules leads economists to classify goods as either substitutes or complements. Substitute goods are goods which, as a result...
. As a result, the supply and demand
Supply and demand
Supply and demand is an economic model of price determination in a market. It concludes that in a competitive market, the unit price for a particular good will vary until it settles at a point where the quantity demanded by consumers will equal the quantity supplied by producers , resulting in an...
in the markets for short-term and long-term instruments is determined largely independently. Prospective investors decide in advance whether they need short-term or long-term instruments. If investors prefer their portfolio to be liquid, they will prefer short-term instruments to long-term instruments. Therefore, the market for short-term instruments will receive a higher demand. Higher demand for the instrument implies higher prices and lower yield. This explains the stylized fact that short-term yields are usually lower than long-term yields. This theory explains the predominance of the normal yield curve shape. However, because the supply and demand of the two markets are independent, this theory fails to explain the observed fact that yields tend to move together (i.e., upward and downward shifts in the curve).
Preferred habitat theory
The preferred habitat theory is another guise of the Market Segmentation theory, and states that in addition to interest rate expectations, investors have distinct investment horizons and require a meaningful premium to buy bonds with maturities outside their "preferred" maturity, or habitat. Proponents of this theory believe that short-term investors are more prevalent in the fixed-income market, and therefore longer-term rates tend to be higher than short-term rates, for the most part, but short-term rates can be higher than long-term rates occasionally. This theory is consistent with both the persistence of the normal yield curve shape and the tendency of the yield curve to shift up and down while retaining its shape.Historical development of yield curve theory
On 15 August 1971, U.S. President Richard NixonRichard Nixon
Richard Milhous Nixon was the 37th President of the United States, serving from 1969 to 1974. The only president to resign the office, Nixon had previously served as a US representative and senator from California and as the 36th Vice President of the United States from 1953 to 1961 under...
announced that the U.S. dollar would no longer be based on the gold standard
Gold standard
The gold standard is a monetary system in which the standard economic unit of account is a fixed mass of gold. There are distinct kinds of gold standard...
, thereby ending the Bretton Woods system
Bretton Woods system
The Bretton Woods system of monetary management established the rules for commercial and financial relations among the world's major industrial states in the mid 20th century...
and initiating the era of floating exchange rate
Floating exchange rate
A floating exchange rate or fluctuating exchange rate is a type of exchange rate regime wherein a currency's value is allowed to fluctuate according to the foreign exchange market. A currency that uses a floating exchange rate is known as a floating currency....
s.
Floating exchange rates made life more complicated for bond traders, including importantly those at Salomon Brothers
Salomon Brothers
Salomon Brothers was a bulge bracket, Wall Street investment bank. Founded in 1910 by three brothers along with a clerk named Ben Levy, it remained a partnership until the early 1980s, when it was acquired by the commodity trading firm Phibro Corporation and then became Salomon Inc. Eventually...
in New York
New York
New York is a state in the Northeastern region of the United States. It is the nation's third most populous state. New York is bordered by New Jersey and Pennsylvania to the south, and by Connecticut, Massachusetts and Vermont to the east...
. By the middle of the 1970s, encouraged by the head of bond research at Salomon, Marty Liebowitz, traders began thinking about bond yields in new ways. Rather than think of each maturity (a ten year bond, a five year, etc.) as a separate marketplace, they began drawing a curve through all their yields. The bit nearest the present time became known as the short end—yields of bonds further out became, naturally, the long end.
Academics had to play catch up with practitioners in this matter. One important theoretic development came from a Czech mathematician, Oldrich Vasicek
Oldrich Vasicek
Oldrich Alfons Vasicek a Czech mathematician, received his master's degree in math from the Czech Technical University, 1964, and a doctorate in probability theory from Charles University four years later....
, who argued in a 1977 paper that bond prices all along the curve are driven by the short end (under risk neutral equivalent martingale measure) and accordingly by short-term interest rates. The mathematical model for Vasicek's work was given by an Ornstein–Uhlenbeck process, but has since been discredited because the model predicts a positive probability that the short rate becomes negative and is inflexible in creating yield curves of different shapes. Vasicek's model has been superseded by many different models including the Hull–White model (which allows for time varying parameters in the Ornstein–Uhlenbeck process), the Cox–Ingersoll–Ross model, which is a modified Bessel process
Bessel process
In mathematics, a Bessel process, named after Friedrich Bessel, is a type of stochastic process. The n-dimensional Bessel process is the real-valued process X given byX_t = \| W_t \|,...
, and the Heath–Jarrow–Morton framework. There are also many modifications to each of these models, but see the article on short rate model
Short rate model
In the context of interest rate derivatives, a short-rate model is a mathematical model that describes the future evolution of interest rates by describing the future evolution of the short rate, usually written r_t \,.-The short rate:...
.
Another modern approach is the LIBOR Market Model
LIBOR Market Model
The LIBOR market model, also known as the BGM Model , is a financial model of interest rates...
, introduced by Brace, Gatarek and Musiela in 1997 and advanced by others later.
In 1996 a group of derivatives traders led by Olivier Doria (then head of swaps at Deutsche Bank) and Michele Faissola, contributed to an extension of the swap yield curves in all the major European currencies. Until then the market would give prices until 15 years maturities. The team extended the maturity of European yield curves up to 50 years (for the lira, French franc, Deutsche mark, Danish krone and many other currencies including the ecu). This innovation was a major contribution towards the issuance of long dated zero coupon bonds and the creation of long dated mortgages.
Construction of the full yield curve from market data
| Type | Settlement date | Rate (%) |
| Cash | Overnight rate | 5.58675 |
| Cash | Tomorrow next rate | 5.59375 |
| Cash | 1m | 5.625 |
| Cash | 3m | 5.71875 |
| Future | Dec-97 | 5.76 |
| Future | Mar-98 | 5.77 |
| Future | Jun-98 | 5.82 |
| Future | Sep-98 | 5.88 |
| Future | Dec-98 | 6.00 |
| Swap | 2y | 6.01253 |
| Swap | 3y | 6.10823 |
| Swap | 4y | 6.16 |
| Swap | 5y | 6.22 |
| Swap | 7y | 6.32 |
| Swap | 10y | 6.42 |
| Swap | 15y | 6.56 |
| Swap | 20y | 6.56 |
| Swap | 30y | 6.56 |
A list of standard instruments used to build a money market yield curve. |
||
The data is for lending in US dollar, taken from October 6, 1997 |
||
The usual representation of the yield curve is a function P, defined on all future times t, such that P(t) represents the value today of receiving one unit of currency t years in the future. If P is defined for all future t then we can easily recover the yield (i.e. the annualized interest rate) for borrowing money for that period of time via the formula

The significant difficulty in defining a yield curve therefore is to determine the function P(t). P is called the discount factor function.
Yield curves are built from either prices available in the bond market or the money market. Whilst the yield curves built from the bond market use prices only from a specific class of bonds (for instance bonds issued by the UK government) yield curves built from the money market
Money market
The money market is a component of the financial markets for assets involved in short-term borrowing and lending with original maturities of one year or shorter time frames. Trading in the money markets involves Treasury bills, commercial paper, bankers' acceptances, certificates of deposit,...
use prices of "cash" from today's LIBOR rates, which determine the "short end" of the curve i.e. for t ≤ 3m, futures which determine the mid-section of the curve (3m ≤ t ≤ 15m) and interest rate swap
Interest rate swap
An interest rate swap is a popular and highly liquid financial derivative instrument in which two parties agree to exchange interest rate cash flows, based on a specified notional amount from a fixed rate to a floating rate or from one floating rate to another...
s which determine the "long end" (1y ≤ t ≤ 60y).
The example given in the table at the right is known as a LIBOR curve because it is constructed using either LIBOR rates or swap rates. A LIBOR curve is the most widely used interest rate curve as it represents the credit worth of private entities at about A+ rating, roughly the equivalent of commercial banks. If one substitutes the LIBOR and swap rates with government bond yields, one arrives at what is known as a government curve, usually considered the risk free interest rate curve for the underlying currency. The spread between the LIBOR or swap rate and the government bond yield, usually positive, meaning private borrowing is at a premium above government borrowing, of similar maturity is a measure of risk tolerance of the lenders. For the U. S. market, a common benchmark for such a spread is given by the so call TED spread.
In either case the available market data provides a matrix A of cash flows, each row representing a particular financial instrument and each column representing a point in time. The (i,j)-th element of the matrix represents the amount that instrument i will pay out on day j. Let the vector F represent today's prices of the instrument (so that the i-th instrument has value F(i)), then by definition of our discount factor function P we should have that F = AP (this is a matrix multiplication). Actually, noise in the financial markets means it is not possible to find a P that solves this equation exactly, and our goal becomes to find a vector P such that

where
 is as small a vector as possible (where the size of a vector might be measured by taking its norm
Norm (mathematics)
In linear algebra, functional analysis and related areas of mathematics, a norm is a function that assigns a strictly positive length or size to all vectors in a vector space, other than the zero vector...
, for example).
Note that even if we can solve this equation, we will only have determined P(t) for those t which have a cash flow from one or more of the original instruments we are creating the curve from. Values for other t are typically determined using some sort of interpolation
Interpolation
In the mathematical field of numerical analysis, interpolation is a method of constructing new data points within the range of a discrete set of known data points....
scheme.
Practitioners and researchers have suggested many ways of solving the A*P = F equation. It transpires that the most natural method – that of minimizing
 by least squares regression – leads to unsatisfactory results. The large number of zeroes in the matrix A mean that function P turns out to be "bumpy".
In their comprehensive book on interest rate modelling James and Webber note that the following techniques have been suggested to solve the problem of finding P:
- Approximation using Lagrange polynomials
- Fitting using parameterised curves (such as splineSplineSpline can refer to:* Spline , a mating feature for rotating elements* Spline , a mathematical function used for interpolation or smoothing* Smoothing spline, a method of smoothing using a spline function...
s, the Nelson–Siegel family, the Svensson family or the Cairns restricted-exponential family of curves). Van Deventer, Imai and Mesler summarize three different techniques for curve fittingCurve fittingCurve fitting is the process of constructing a curve, or mathematical function, that has the best fit to a series of data points, possibly subject to constraints. Curve fitting can involve either interpolation, where an exact fit to the data is required, or smoothing, in which a "smooth" function...
that satisfy the maximum smoothness of either forward interest rates, zero coupon bond prices, or zero coupon bond yields - Local regression using kernelsKernel (statistics)A kernel is a weighting function used in non-parametric estimation techniques. Kernels are used in kernel density estimation to estimate random variables' density functions, or in kernel regression to estimate the conditional expectation of a random variable. Kernels are also used in time-series,...
- Linear programmingLinear programmingLinear programming is a mathematical method for determining a way to achieve the best outcome in a given mathematical model for some list of requirements represented as linear relationships...
In the money market practitioners might use different techniques to solve for different areas of the curve. For example at the short end of the curve, where there are few cashflows, the first few elements of P may be found by bootstrapping
Bootstrapping (finance)
Bootstrapping is a method for constructing a fixed-income yield curve from the prices of a set of coupon-bearing products by forward substitution....
from one to the next. At the long end, a regression technique with a cost function that values smoothness might be used.
How the yield curve affects bond prices
There is a time dimension to the analysis of bond values. A 10-year bond at purchase becomes a 9-year bond a year later, and the year after that an 8-year bond, etc. Each year the bond moves incrementally closer to maturity, resulting in lower volatility and shorter duration and demanding a lower interest rate when the yield curve is rising. Since falling rates create increasing prices, the value of a bond initially will rise as the lower rates of the shorter maturity become its new market rate. Because a bond is always anchored by its final maturity, the price at some point must change direction and fall to par value at redemption.A bond's market value at different times in its life can be calculated. When the yield curve is steep the bond is predicted to have a large capital gain in the first years before falling in price later. When the yield curve is flat, the capital gain is predicted to be much less, and there is little variability in the bond's total returns over time.
Rising (or falling) interest rates rarely rise by the same amount all along the yield curve - the curve rarely moves up in parallel. Because longer-term bonds have a larger duration a rise in rates will cause a larger capital loss for them, than for short-term bonds. But almost always, the long maturity's rate will change much less, flattening the yield curve. The greater change in rates at the short end will offset to some extent the advantage provided by the shorter bond's lower duration.
The yearly 'total return' from the bond is a) the sum of the coupon's yield plus b) the capital gain from the changing valuation as it slides down the yield curve and c) any capital gain or loss from changing interest rates at that point in the yield curve.
Relationship to the business cycle
The slope of the yield curve is one of the most powerful predictors of future economic growth, inflation, and recessions. One measure of the yield curve slope (i.e. the difference between 10-year Treasury bond rates and the federal funds rateFederal funds rate
In the United States, the federal funds rate is the interest rate at which depository institutions actively trade balances held at the Federal Reserve, called federal funds, with each other, usually overnight, on an uncollateralized basis. Institutions with surplus balances in their accounts lend...
) is included in the Index of Leading Economic Indicators.
An inverted yield curve is often a harbinger of recession
Recession
In economics, a recession is a business cycle contraction, a general slowdown in economic activity. During recessions, many macroeconomic indicators vary in a similar way...
. A positively sloped yield curve is often a harbinger of inflationary
Inflation
In economics, inflation is a rise in the general level of prices of goods and services in an economy over a period of time.When the general price level rises, each unit of currency buys fewer goods and services. Consequently, inflation also reflects an erosion in the purchasing power of money – a...
growth. Work by Dr. Arturo Estrella & Dr. Tobias Adrian has established the predictive power of an inverted yield curve to signal a recession. Their model show that when the difference between short-term interest rates (he uses 3-month T-bills) and long-term interest rates (10-year Treasury bonds) at the end of a federal reserve tightening cycle is negative or less than 93 basis points positive that a rise in unemployment usually occurs.
All of the recessions in the US since 1970 (up thru 2011) have been preceded by an inverted yield curve. Over the same time frame, every occurrence of an inverted yield curve has been followed by recession as declared by the NBER
National Bureau of Economic Research
The National Bureau of Economic Research is an American private nonprofit research organization "committed to undertaking and disseminating unbiased economic research among public policymakers, business professionals, and the academic community." The NBER is well known for providing start and end...
business cycle dating committee.
| Event | Date of Inversion Start | Date of the Recession Start | Time from Inversion to Recession Start | Duration of Inversion | Time from Disinversion to Recession End | Duration of Recession | Max Inversion |
|---|---|---|---|---|---|---|---|
| Months | Months | Months | Months | Basis Points | |||
| 1970 Recession | Dec-68 | Jan-70 | 13 | 15 | 8 | 11 | −52 |
| 1974 Recession | Jun-73 | Dec-73 | 6 | 18 | 3 | 16 | −159 |
| 1980 Recession | Nov-78 | Feb-80 | 15 | 18 | 2 | 6 | −328 |
| 1981-1982 Recession | Oct-80 | Aug-81 | 10 | 12 | 13 | 16 | −351 |
| 1990 Recession | Jun-89 | Aug-90 | 14 | 7 | 14 | 8 | −16 |
| 2001 Recession | Jul-00 | Apr-01 | 9 | 7 | 9 | 8 | −70 |
| 2008-2009 Recession | Aug-06 | Jan-08 | 17 | 10 | 24 | 18 | −51 |
| Average since 1969 | 12 | 12 | 10 | 12 | −147 | ||
| Std Dev since 1969 | .83 | 4.72 | 7.5 | 4.78 | 138.96 |
Dr. Estrella has postulated that the yield curve affects the business cycle via the balance sheet of banks. When the yield curve is inverted banks are often caught paying more on short-term deposits than they are making on long-term loans leading to a loss of profitability and reluctance to lend resulting in a credit crunch
Credit crunch
A credit crunch is a reduction in the general availability of loans or a sudden tightening of the conditions required to obtain a loan from the banks. A credit crunch generally involves a reduction in the availability of credit independent of a rise in official interest rates...
. When the yield curve is upward sloping banks can profitably take-in short term deposits and make long-term loans so they are eager to supply credit to borrowers.
External links
- Euro area yield curves – European Central Bank website
- Dynamic Yield Curve – This chart shows the relationship between interest rates and stocks over time.
- NYFed Current Issue – Current Issue of New York Federal Reserve outlining their view of inverted yield curve