

Weather map
Encyclopedia
Weather forecasting
Weather forecasting is the application of science and technology to predict the state of the atmosphere for a given location. Human beings have attempted to predict the weather informally for millennia, and formally since the nineteenth century...
purposes. Maps using isotherms show temperature gradients, which can help locate weather fronts. Isotach maps, analyzing lines of equal [but]] speed, on a constant pressure surface of 300 mb or 250 mb show where the jet stream
Jet stream
Jet streams are fast flowing, narrow air currents found in the atmospheres of some planets, including Earth. The main jet streams are located near the tropopause, the transition between the troposphere and the stratosphere . The major jet streams on Earth are westerly winds...
is located. Use of constant pressure charts at the 700 and 500 hPa level can indicate tropical cyclone
Tropical cyclone
A tropical cyclone is a storm system characterized by a large low-pressure center and numerous thunderstorms that produce strong winds and heavy rain. Tropical cyclones strengthen when water evaporated from the ocean is released as the saturated air rises, resulting in condensation of water vapor...
motion. Two-dimensional streamline
Streamlines, streaklines and pathlines
Fluid flow is characterized by a velocity vector field in three-dimensional space, within the framework of continuum mechanics. Streamlines, streaklines and pathlines are field lines resulting from this vector field description of the flow...
s based on wind speeds at various levels show areas of convergence
Convergence
-Mathematics:* Convergence , refers to the notion that some functions and sequences approach a limit under certain conditions* Convergence , the notion that a sequence of transformations come to the same conclusion, no matter what order they are performed in.-Natural sciences:*Convergence ,...
and divergence
Divergence
In vector calculus, divergence is a vector operator that measures the magnitude of a vector field's source or sink at a given point, in terms of a signed scalar. More technically, the divergence represents the volume density of the outward flux of a vector field from an infinitesimal volume around...
in the wind field, which are helpful in determining the location of features within the wind pattern. A popular type of surface weather map is the surface weather analysis
Surface weather analysis
Surface weather analysis is a special type of weather map that provides a view of weather elements over a geographical area at a specified time based on information from ground-based weather stations...
, which plots isobars to depict areas of high pressure
High pressure area
A high-pressure area is a region where the atmospheric pressure at the surface of the planet is greater than its surrounding environment. Winds within high-pressure areas flow outward due to the higher density air near their center and friction with land...
and low pressure
Low pressure area
A low-pressure area, or "low", is a region where the atmospheric pressure at sea level is below that of surrounding locations. Low-pressure systems form under areas of wind divergence which occur in upper levels of the troposphere. The formation process of a low-pressure area is known as...
. Special weather maps in aviation
Aviation
Aviation is the design, development, production, operation, and use of aircraft, especially heavier-than-air aircraft. Aviation is derived from avis, the Latin word for bird.-History:...
show areas of icing and turbulence for the other
History
The use of weather charts in a modern sense began in the middle portion of the 19th century in order to devise a theory on storm systems.In the USA the development of a telegraph network by 1845 made it possible to gather weather information from multiple distant locations quickly enough to preserve its value for real-time applications. The Smithsonian Institution developed its network of observers over much of the central and eastern United States between the 1840s and 1860s once Joseph Henry took the helm. The U.S. Army Signal Corps inherited this network between 1870 and 1874 by an act of Congress, and expanded it to the west coast soon afterwards.
At first, all the data on the map was not taken from these analyses because of a lack of time standardization.
The first attempts at time standardization took hold in Great Britain by 1855. The entire United States did not finally come under the influence of time zones until 1905, when Detroit finally established standard time. Internationally, other countries followed the lead of the United States in taking simultaneous weather observations, starting in 1873. Other countries then began preparing surface analyses. The use of frontal zones on weather maps did not appear until the introduction of the Norwegian cyclone model
Norwegian cyclone model
The older of the models of extratropical cyclone development is known as the Norwegian Cyclone Model, developed during and shortly after World War I within the Bergen School of Meteorology. In this theory, cyclones develop as they move up and along a frontal boundary, eventually occluding and...
in the late 1910s, despite Loomis' earlier attempt at a similar notion in 1841. Since the leading edge of air mass changes bore resemblance to the military fronts of World War I
World War I
World War I , which was predominantly called the World War or the Great War from its occurrence until 1939, and the First World War or World War I thereafter, was a major war centred in Europe that began on 28 July 1914 and lasted until 11 November 1918...
, the term "front" came into use to represent these lines.
Cyclone
In meteorology, a cyclone is an area of closed, circular fluid motion rotating in the same direction as the Earth. This is usually characterized by inward spiraling winds that rotate anticlockwise in the Northern Hemisphere and clockwise in the Southern Hemisphere of the Earth. Most large-scale...
model just after World War I, the United States did not formally analyze fronts on surface analyses until late 1942, when the WBAN Analysis Center opened in downtown Washington, D.C.
Washington, D.C.
Washington, D.C., formally the District of Columbia and commonly referred to as Washington, "the District", or simply D.C., is the capital of the United States. On July 16, 1790, the United States Congress approved the creation of a permanent national capital as permitted by the U.S. Constitution....
. In addition to surface weather maps, since July 1, 1948, the United States has generated constant pressure charts within their Daily Weather Map series. At first, the level analyzed regularly was 700 hPa, which is around 3000 metres (9,842.5 ft) above sea level
Sea level
Mean sea level is a measure of the average height of the ocean's surface ; used as a standard in reckoning land elevation...
. By May 14, 1954, the 500 hPa surface was being analyzed, which is about 5520 metres (18,110.2 ft) above sea level. The effort to automate map plotting began in the United States in 1969, with the process complete in the 1970s. Hong Kong
Hong Kong
Hong Kong is one of two Special Administrative Regions of the People's Republic of China , the other being Macau. A city-state situated on China's south coast and enclosed by the Pearl River Delta and South China Sea, it is renowned for its expansive skyline and deep natural harbour...
completed their process of automated surface plotting by 1987. By 1999, computer systems and software had finally become sophisticated enough to allow for the ability to underlay on the same workstation satellite imagery, radar imagery, and model-derived fields such as atmospheric thickness and frontogenesis in combination with surface observations to make for the best possible surface analysis. In the United States, this development was achieved when Intergraph
Intergraph
Intergraph Corporation is an American software development and services company. It provides enterprise engineering and geospatially powered software to businesses, governments, and organizations around the world. Intergraph operates through two divisions: Process, Power & Marine and Security,...
workstations were replaced by n-AWIPS
Advanced Weather Interactive Processing System
The Advanced Weather Interactive Processing System is a technologically-advanced processing, display, and telecommunications system that is the cornerstone of the United States National Weather Service's operations....
workstations. By 2001, the various surface analyses done within the National Weather Service were combined into the Unified Surface Analysis, which is issued every six hours and combines the analyses of four different centers. Recent advances in both the fields of meteorology
Meteorology
Meteorology is the interdisciplinary scientific study of the atmosphere. Studies in the field stretch back millennia, though significant progress in meteorology did not occur until the 18th century. The 19th century saw breakthroughs occur after observing networks developed across several countries...
and geographic information system
Geographic Information System
A geographic information system, geographical information science, or geospatial information studies is a system designed to capture, store, manipulate, analyze, manage, and present all types of geographically referenced data...
s have made it possible to devise finely tailored products that take us from the traditional weather map into an entirely new realm. Weather information can quickly be matched to relevant geographical detail. For instance, icing conditions can be mapped onto the road network. This will likely continue to lead to changes in the way surface analyses are created and displayed over the next several years.
Plotting of data
A station model
Station model
A station model is a symbolic illustration showing the weather occurring at a given reporting station. Meteorologists created the station model to plot a number of weather elements in a small space on weather maps...
is a symbolic illustration showing the weather
Weather
Weather is the state of the atmosphere, to the degree that it is hot or cold, wet or dry, calm or stormy, clear or cloudy. Most weather phenomena occur in the troposphere, just below the stratosphere. Weather refers, generally, to day-to-day temperature and precipitation activity, whereas climate...
occurring at a given reporting station
Weather station
A weather station is a facility, either on land or sea, with instruments and equipment for observing atmospheric conditions to provide information for weather forecasts and to study the weather and climate. The measurements taken include temperature, barometric pressure, humidity, wind speed, wind...
. Meteorologists created the station model to plot a number of weather elements in a small space on weather maps. Maps filled with dense station-model plots can be difficult to read, but they allow meteorologists, pilots, and mariners to see important weather patterns. A computer draws a station model for each observation location. The station model is primarily used on surface-weather maps, but can also be used to show the weather aloft. A completed station-model map allows users to analyze patterns in air pressure, temperature, wind, cloud cover, and precipitation.
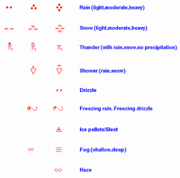
Station model plots use an internationally-accepted coding convention that has changed little since August 1, 1941. Elements in the plot show the key weather elements, including temperature
Temperature
Temperature is a physical property of matter that quantitatively expresses the common notions of hot and cold. Objects of low temperature are cold, while various degrees of higher temperatures are referred to as warm or hot...
, dewpoint, wind, cloud cover, air pressure, pressure tendency, and precipitation. Winds have a standard notation when plotted on weather maps. More than a century ago, winds were plotted as arrows, with feathers on just one side depicting five knots of wind, while feathers on both sides depicted 10 knots (19.6 km/h) of wind. The notation changed to that of half of an arrow, with half of a wind barb indicating five knots, a full barb ten knots, and a pennant flag fifty knots.
Aviation maps
AviationAviation
Aviation is the design, development, production, operation, and use of aircraft, especially heavier-than-air aircraft. Aviation is derived from avis, the Latin word for bird.-History:...
interests have their own set of weather maps. One type of map shows where VFR (visual flight rules) are in effect and where IFR (instrument flight rules) are in effect. Weather depiction plots show ceiling height (level where at least half the sky is covered with clouds) in hundreds of feet, present weather, and cloud cover. Icing maps depict areas where icing can be a hazard for flying. Aviation-related maps also show areas of turbulence.
Constant pressure charts
Troposphere
The troposphere is the lowest portion of Earth's atmosphere. It contains approximately 80% of the atmosphere's mass and 99% of its water vapor and aerosols....
. Areas with small dewpoint depressions and are below freezing indicate the presence of icing conditions for aircraft. The 500 hPa pressure surface can be used as a rough guide for the motion of many tropical cyclone
Tropical cyclone
A tropical cyclone is a storm system characterized by a large low-pressure center and numerous thunderstorms that produce strong winds and heavy rain. Tropical cyclones strengthen when water evaporated from the ocean is released as the saturated air rises, resulting in condensation of water vapor...
s. Shallower tropical cyclones, which have experienced vertical wind shear
Wind shear
Wind shear, sometimes referred to as windshear or wind gradient, is a difference in wind speed and direction over a relatively short distance in the atmosphere...
, tend to be steered by winds at the 700 hPa level.
Use of the 300 and 200 hPa constant pressure charts can indicate the strength of systems in the lower troposphere, as stronger systems near the Earth's surface are reflected as stronger features at these levels of the atmosphere. Isotachs are drawn at these levels, which a lines of equal wind speed. They are helpful in finding maxima and minima in the wind pattern. Minima in the wind pattern aloft are favorable for tropical cyclogenesis
Tropical cyclogenesis
Tropical cyclogenesis is the term that describes the development and strengthening of a tropical cyclone in the atmosphere. The mechanisms through which tropical cyclogenesis occurs are distinctly different from those through which mid-latitude cyclogenesis occurs...
. Maxima in the wind pattern at various levels of the atmosphere show locations of jet streams. Areas colder than -40 C indicate a lack of significant icing, as long as there is no active thunderstorm
Thunderstorm
A thunderstorm, also known as an electrical storm, a lightning storm, thundershower or simply a storm is a form of weather characterized by the presence of lightning and its acoustic effect on the Earth's atmosphere known as thunder. The meteorologically assigned cloud type associated with the...
activity.
Surface weather analysis
A surface weather analysis is a type of weather map that depicts positions for high
High pressure area
A high-pressure area is a region where the atmospheric pressure at the surface of the planet is greater than its surrounding environment. Winds within high-pressure areas flow outward due to the higher density air near their center and friction with land...
and low pressure area
Low pressure area
A low-pressure area, or "low", is a region where the atmospheric pressure at sea level is below that of surrounding locations. Low-pressure systems form under areas of wind divergence which occur in upper levels of the troposphere. The formation process of a low-pressure area is known as...
s, as well as various types of synoptic scale systems such as frontal zones. Isotherms can be drawn on these maps, which are lines of equal temperature. Isotherms are drawn normally as solid lines at a preferred temperature interval. They show temperature gradients, which can be useful in finding fronts, which are on the warm side of large temperature gradients. By plotting the freezing line, isotherms can be useful in determination of precipitation type. Mesoscale boundaries such as tropical cyclone
Tropical cyclone
A tropical cyclone is a storm system characterized by a large low-pressure center and numerous thunderstorms that produce strong winds and heavy rain. Tropical cyclones strengthen when water evaporated from the ocean is released as the saturated air rises, resulting in condensation of water vapor...
s, outflow boundaries and squall line
Squall line
A squall line is a line of severe thunderstorms that can form along or ahead of a cold front. In the early 20th century, the term was used as a synonym for cold front. It contains heavy precipitation, hail, frequent lightning, strong straight-line winds, and possibly tornadoes and waterspouts....
s also are analyzed on surface weather analyses.
Isobaric analysis is performed on these maps, which involves the construction of lines of equal mean sea level pressure. The innermost closed lines indicate the positions of relative maxima and minima in the pressure field. The minima are called low pressure areas while the maxima are called high-pressure areas. Highs are often shown as H's whereas lows are shown as L's. Elongated areas of low pressure, or troughs, are sometimes plotted as thick, brown dashed lines down the trough axis. Isobars are commonly used to place surface boundaries from the horse latitudes
Horse latitudes
Horse Latitudes or Subtropical High are subtropical latitudes between 30 and 35 degrees both north and south. This region, under a ridge of high pressure called the subtropical high, is an area which receives little precipitation and has variable winds mixed with calm.The consistently warm, dry...
poleward, while streamline analyses are used in the tropics. A streamline analysis is a series of arrows oriented parallel to wind, showing wind motion within a certain geographic area. C's depict cyclonic flow or likely areas of low pressure, while A's depict anticyclonic flow or likely positions of high pressure areas. An area of confluent streamlines shows the location of shearlines within the tropics and subtropics.
See also
- Isobar
- Prognostic chartPrognostic chartPrognostic charts are maps which display what the weather is expected to be like at a future time; in other words, a forecast map. Within the United States, manual prognostic charts generated by the National Centers for Environmental Prediction have special symbols which require interpretation...
- Surface weather analysisSurface weather analysisSurface weather analysis is a special type of weather map that provides a view of weather elements over a geographical area at a specified time based on information from ground-based weather stations...