
Wealth in the United States
Encyclopedia
Net worth
In business, net worth is the total assets minus total outside liabilities of an individual or a company. For a company, this is called shareholders' preference and may be referred to as book value. Net worth is stated as at a particular year in time...
, which is the sum of all asset
Asset
In financial accounting, assets are economic resources. Anything tangible or intangible that is capable of being owned or controlled to produce value and that is held to have positive economic value is considered an asset...
s, including home equity
Home equity
Home equity is the market value of a homeowner's unencumbered interest in their real property—that is, the difference between the home's fair market value and the outstanding balance of all liens on the property. The property's equity increases as the debtor makes payments against the...
, minus all liabilities.
For example, a household in possession of an $800,000 house, $5,000 in mutual funds, $30,000 in cars, $20,000 worth of stock in their own company, and a $45,000 IRA would have assets totaling $900,000. Assuming that this household would have a $250,000 mortgage, $40,000 in car loans, and $10,000 in credit card debt, its debts would total $300,000. Subtracting the debts from the worth of this household's assets (900,000 - $300,000 = $600,000), this household would have a net worth of $600,000. Net worth can vary with fluctuations in value of the underlying assets.
The wealth—more specifically, the median net worth—of households in the United States is varied with relation to race, education, geographic location and gender. As one would expect, households with greater income feature the highest net worths, though high income cannot be taken as an always accurate indicator of net worth. Overall the number of wealthier households is on the rise, with baby boomers hitting the highs of their careers. In addition, wealth is unevenly distributed, with the wealthiest 25% of US households owning 87% of the wealth in the United States, which was $54.2 trillion in 2009.
Income vs. Wealth
While income is often seen as a type of wealth in colloquial language use, wealth and income are two substantially different measures of economic prosperity. While there may be a high correlation between income and wealth, the relationship cannot be described as causal.Changes in wealth, 1989–2001
When observing the changes in the wealth among American households, one can note an increase in wealthier individuals and a decrease in the number of poor households, while net worth increased most substantially in semi-wealthy and wealthy households. Overall the percentage of households with a negative net worth (more debt than assets) declined from 9.5% in 1989 to 4.1% in 2001.The percentage of net worths ranging from $500,000 to one million doubled while the percentage of millionaires tripled. From 1995 to 2004, there was tremendous growth among household wealth, as it nearly doubled from $21.9 trillion to $43.6 trillion, but the wealthiest quartile of the economic distribution made up 89% of this growth. During this time frame, wealth became increasingly unequal, and the wealthiest 25% became even wealthier.
According to US Census Bureau statistics this "Upward shift" is most likely the result of a booming housing market which caused homeowners to experience tremendous increases in home equity. Life-cycles have also attributed to the rising wealth among Americans. With more and more baby-boomers reaching the climax of their careers and the middle aged population making up a larger segment of the population now than ever before, more and more households have achieved comfortable levels of wealth. Zhu Xiao Di (2004) notes that household wealth usually peaks around families headed by people in their 50s, and as a result, the baby boomer generation reached this age range at the time of the analysis.
Changes in wealth after 2007
Household net worth fell from 2007 to 2009 by a total of $17.5 trillion or 25.5%. This was the equivalent loss of one year of GDP.By the fourth quarter of 2010, the household net worth had recovered by a growth of 1.3 percent to a total of $56.8 trillion. An additional growth of 15.7 percent is needed just to bring the value to where it was before the recession started in December 2007.
Mechanisms to gain wealth
Assets are known as the raw materials of wealth, and they consist primarily of stocks and other financial and non-financial property, particularly homeownership. While these assets are unequally distributed, financial assets are much more unequal. In 2004, the top 1% controlled 50.3% of the financial assets while the bottom 90% only held 14.4% of the total US financial assets.These discrepancies exist despite the availability of many wealth building tools established by the Federal Government. These include 401k plans, 403b plans, and IRAs. Traditional IRAs, 401k and 403b plans are tax shelters created for working individuals. These plans allow for tax sheltered (or pre-tax) contributions of earned income directly to tax sheltered savings accounts. Annual contributions are capped to ensure that high earners cannot enjoy the tax benefit proportionally. The Roth IRA is another tool that can help create wealth in the working and middle classes. Assets in Roth IRAs grow tax free; interests, dividends, and capital gains are all exempt from income taxes. Contributions to Roth IRAs are limited to those with annual incomes less than the threshold established yearly by the IRS. The benefits of these plans, however, are only available to workers and families whose incomes and expenses allow them excess funds to commit for a long period, typically until the investor reaches age 59½. The effect of these tools are further limited by the contribution limits placed on them.
Wealth inequality
According to the Congressional Budget OfficeCongressional Budget Office
The Congressional Budget Office is a federal agency within the legislative branch of the United States government that provides economic data to Congress....
, between 1979 and 2007 incomes of the top 1% of Americans grew by an average of 275%. During the same time period, the 60% of Americans in the middle of the income scale saw their income rise by 40%. Since 1979 the average pre-tax income for the bottom 90% of households has decreased by $900, while that of the top 1% increased by over $700,000, as federal taxation became less progressive
Progressive tax
A progressive tax is a tax by which the tax rate increases as the taxable base amount increases. "Progressive" describes a distribution effect on income or expenditure, referring to the way the rate progresses from low to high, where the average tax rate is less than the marginal tax rate...
. From 1992-2007 the top 400 income earners in the U.S. saw their income increase 392% and their average tax rate reduced by 37%. In 2009, the average income of the top 1% was $960,000 with a minimum income of $343,927.
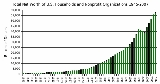
In 2007 the richest 1% of the American population owned 34.6% of the country's total wealth, and the next 19% owned 50.5%. Thus, the top 20% of Americans owned 85% of the country's wealth and the bottom 80% of the population owned 15%. Financial inequality was greater than inequality in total wealth, with the top 1% of the population owning 42.7%, the next 19% of Americans owning 50.3%, and the bottom 80% owning 7%. However, after the Great Recession which started in 2007, the share of total wealth owned by the top 1% of the population grew from 34.6% to 37.1%, and that owned by the top 20% of Americans grew from 85% to 87.7%. The Great Recession also caused a drop of 36.1% in median household wealth but a drop of only 11.1% for the top 1%, further widening the gap between the 1% and the 99%. During the economic expansion between 2002 and 2007, the income of the top 1% grew 10 times faster than the income of the bottom 90%. In this period 66% of total income gains went to the 1%, who in 2007 had a larger share of total income than at any time since 1928.
Wealth and Housing
Home ownership is one of the main sources of wealth among families in the United States. However, there are racial differences in the acquisition of housing, and this inequality reproduces stratification in housing wealth across the races. For white families, homeownership is worth, on average, $60,000 more than it is worth for black families. The idea of buying a house to let it appreciate in value over time in order to increase wealth is not possible for some people of color. For black families, higher interest rates often cause roadblocks to home ownership.Because Blacks pay on average, interest rates about 1/3 higher than whites, they are unable to afford the housing, because this subtle change can add up over time. One explanation for why there are higher interest rates is because whites typically come to the table with more assets in the form of down payments which sets them up to pay lower interest rates. Black families do not typically have these assets or down payments to place down on a home in order to lower the interest rates. White Flight
White flight
White flight has been a term that originated in the United States, starting in the mid-20th century, and applied to the large-scale migration of whites of various European ancestries from racially mixed urban regions to more racially homogeneous suburban or exurban regions. It was first seen as...
also decreases the value of African American homes as they are not able to resale their house at reasonable value.
It also cannot be ignored that Black Americans have been hit hardest by the historical practice of redlining, which continues today. That and the sub-prime mortgage fiasco, also focused at Black families, contributed to both strip equity out of black neighborhoods and wealth from Black families.
Recent statistics (2003) have shown that the homeownership rates for blacks are close to 25 percentage points less than white families (Whites = 75.4% homeownership rates, Blacks = 48.1%). Homeownership among Latino Americans is lower than other groups in the United States with a rate of 47%. For Asian/Pacific Islander, the homeownership rate is 56.3%. For Native American, it is 54.3%.
Distribution of wealth
The total value of all U.S. household wealth in 2000 was approximately $44 trillion. Prior to the Late-2000s recession which began in December 2007 its value was at $65.9 trillion. After, it plunged to $48.5 trillion during the first quarter of 2009. The total household net worth rose 1.3% by the fourth quarter of 2009 to $54.2 trillion, indicating the American economy is recovering.| Family net worth, by selected characteristics of families, 1989–2004 surveys | ||||||||||||
| Thousands of 2004 dollars | |
|
|
|
|
|
|
|
|
|
|
|
| Family characteristic | 1989 | 1992 | 1995 | 1998 | 2001 | 2004 | ||||||
| Median | Mean | Median | Mean | Median | Mean | Median | Mean | Median | Mean | Median | Mean | |
| |
|
|
|
|
|
|
|
|
|
|
|
|
| All Families | 68.8 | 272.6 | 65.2 | 245.7 | 70.8 | 260.8 | 83.1 | 327.5 | 92.2 | 422.9 | 93.1 | 448.2 |
| |
|
|
|
|
|
|
|
|
|
|
|
|
| |
|
|
|
|
|
|
|
|
|
|
|
|
| Percentiles of income | |
|
|
|
|
|
|
|
|
|
|
|
| Less than 20 | 2.6 | 36.2 | 5.2 | 43.4 | 7.4 | 54.7 | 6.8 | 55.4 | 8.4 | 56.2 | 7.5 | 72.6 |
| 20-39.9 | 35.3 | 96.4 | 36.6 | 84.6 | 41.3 | 97.4 | 38.4 | 111.4 | 39.9 | 122.7 | 33.7 | 121.5 |
| 40-59.9 | 61.1 | 148.5 | 52.1 | 133.3 | 57.1 | 126.0 | 61.9 | 146.6 | 67.8 | 173.3 | 72.0 | 194.6 |
| 60-79.9 | 97.5 | 199.3 | 99.3 | 185.4 | 93.6 | 198.5 | 130.2 | 238.3 | 152.6 | 313.2 | 160.0 | 340.8 |
| 80-89.9 | 193.5 | 326.1 | 151.8 | 297.1 | 157.7 | 316.8 | 218.5 | 377.1 | 280.3 | 487.0 | 313.3 | 487.4 |
| 90-100 | 569.5 | 1,438.5 | 479.3 | 1,266.0 | 436.9 | 1,338.0 | 524.4 | 1,793.9 | 887.9 | 2,410.9 | 924.1 | 2,534.6 |
| |
|
|
|
|
|
|
|
|
|
|
|
|
| Age of head (years) | |
|
|
|
|
|
|
|
|
|
|
|
| Less than 35 | 11.4 | 68.7 | 12.0 | 59.7 | 14.8 | 53.2 | 10.6 | 74.0 | 12.5 | 96.6 | 14.2 | 73.5 |
| 35-44 | 82.7 | 216.4 | 58.7 | 175.5 | 64.2 | 176.8 | 73.5 | 227.6 | 82.6 | 276.6 | 69.4 | 299.2 |
| 45-54 | 144.8 | 405.1 | 103.1 | 353.3 | 116.8 | 364.8 | 122.5 | 420.2 | 141.6 | 517.6 | 144.7 | 542.7 |
| 55-64 | 143.5 | 451.2 | 150.2 | 445.4 | 141.9 | 471.0 | 148.2 | 617.0 | 197.4 | 779.5 | 248.7 | 843.8 |
| 65-74 | 112.4 | 410.2 | 130.0 | 377.6 | 136.6 | 429.3 | 169.8 | 541.1 | 189.4 | 722.6 | 190.1 | 690.9 |
| 75 or more | 106.2 | 354.2 | 114.5 | 282.3 | 114.5 | 317.9 | 145.6 | 360.3 | 165.4 | 499.6 | 163.1 | 528.1 |
| |
|
|
|
|
|
|
|
|
|
|
|
|
| Education of head | |
|
|
|
|
|
|
|
|
|
|
|
| No high school diploma | 35.3 | 121.8 | 24.6 | 92.4 | 27.9 | 103.7 | 24.5 | 91.4 | 27.2 | 110.8 | 20.6 | 136.5 |
| High school diploma | 54.0 | 163.3 | 50.7 | 147.1 | 63.9 | 163.7 | 62.7 | 182.9 | 61.8 | 193.0 | 68.7 | 196.8 |
| Some college | 67.4 | 273.3 | 76.0 | 226.0 | 57.6 | 232.3 | 85.6 | 275.5 | 77.5 | 305.7 | 69.3 | 308.6 |
| College degree | 162.8 | 530.2 | 129.4 | 447.5 | 128.6 | 473.6 | 169.7 | 612.3 | 227.2 | 848.0 | 226.1 | 851.3 |
| |
|
|
|
|
|
|
|
|
|
|
|
|
| Race or ethnicity of respondent | |
|
|
|
|
|
|
|
|
|
|
|
| White non-Hispanic | 104.2 | 333.4 | 91.9 | 292.9 | 94.3 | 308.7 | 111.0 | 391.1 | 130.2 | 520.2 | 140.7 | 561.8 |
| Nonwhite or Hispanic | 9.8 | 92.1 | 15.8 | 102.0 | 19.5 | 94.9 | 19.3 | 116.5 | 19.1 | 125.1 | 24.8 | 153.1 |
| |
|
|
|
|
|
|
|
|
|
|
|
|
| Current work status of head | |
|
|
|
|
|
|
|
|
|
|
|
| Working for someone else | 55.7 | 166.7 | 51.6 | 161.0 | 60.3 | 168.4 | 61.2 | 194.8 | 69.3 | 240.3 | 67.2 | 268.5 |
| Self-employed | 248.7 | 955.2 | 190.2 | 790.6 | 191.8 | 862.7 | 288.0 | 1,071.3 | 375.2 | 1,342.9 | 335.6 | 1,423.2 |
| Retired | 96.9 | 267.9 | 92.9 | 250.1 | 99.9 | 277.2 | 131.0 | 356.5 | 123.1 | 483.6 | 139.8 | 469.0 |
| Other not working | 1.2 | 57.6 | 4.3 | 70.0 | 4.5 | 70.1 | 4.1 | 85.8 | 9.5 | 192.3 | 11.8 | 162.3 |
| |
|
|
|
|
|
|
|
|
|
|
|
|
| Region | |
|
|
|
|
|
|
|
|
|
|
|
| Northeast | 128.1 | 316.1 | 84.5 | 277.2 | 102.0 | 308.9 | 109.3 | 351.3 | 99.3 | 483.2 | 161.7 | 569.1 |
| Midwest | 77.0 | 274.8 | 75.1 | 228.1 | 80.8 | 244.7 | 93.1 | 288.5 | 113.3 | 363.3 | 115.0 | 436.1 |
| South | 51.7 | 192.8 | 45.5 | 185.5 | 54.2 | 229.5 | 71.0 | 309.6 | 78.6 | 400.6 | 63.8 | 348.0 |
| West | 67.2 | 360.0 | 94.2 | 335.4 | 67.4 | 286.1 | 71.1 | 379.1 | 93.4 | 470.4 | 94.8 | 523.7 |
| |
|
|
|
|
|
|
|
|
|
|
|
|
| Housing status | |
|
|
|
|
|
|
|
|
|
|
|
| Owner | 147.1 | 394.8 | 130.2 | 355.7 | 128.1 | 373.7 | 153.2 | 468.7 | 183.8 | 596.9 | 184.4 | 624.9 |
| Renter or other | 2.9 | 56.3 | 4.2 | 50.9 | 6.0 | 53.8 | 4.9 | 50.4 | 5.1 | 58.6 | 4.0 | 54.1 |
| |
|
|
|
|
|
|
|
|
|
|
|
|
| Percentiles of net worth | |
|
|
|
|
|
|
|
|
|
|
|
| Less than 25 | 0.3 | -0.9 | 0.6 | -0.8 | 1.2 | -0.2 | 0.6 | -2.1 | 1.2 | † | 1.7 | -1.4 |
| 25-49.9 | 30.9 | 33.7 | 30.9 | 33.4 | 34.7 | 37.6 | 37.9 | 41.6 | 43.5 | 47.2 | 43.6 | 47.1 |
| 50-74.9 | 127.0 | 130.4 | 115.4 | 119.2 | 117.1 | 122.6 | 139.7 | 149.1 | 168.2 | 177.9 | 170.7 | 185.4 |
| 75-89.9 | 308.2 | 331.2 | 268.5 | 287.4 | 272.3 | 293.6 | 357.7 | 372.7 | 458.8 | 480.7 | 506.8 | 526.7 |
| 90-100 | 1,009.5 | 1,820.7 | 876.2 | 1,645.8 | 836.7 | 1,766.7 | 1,039.1 | 2,244.2 | 1,388.5 | 2,944.3 | 1,430.1 | 3,114.2 |
| Note: See note to table 1. † Less than 0.05 ($50). | |
|
|
|
|
|
|
|||||
See also
- Household income in the United StatesHousehold income in the United StatesHousehold income is a measure commonly used by the United States government and private institutions, that counts the income of all residents over the age of 18 in each household, including not only all wages and salaries, but such items as unemployment insurance, disability payments, child support...
- Poverty in the United StatesPoverty in the United StatesPoverty is defined as the state of one who lacks a usual or socially acceptable amount of money or material possessions. According to the U.S. Census Bureau data released Tuesday September 13th, 2011, the nation's poverty rate rose to 15.1% in 2010, up from 14.3% in 2009 and to its highest level...
- Economy of the United StatesEconomy of the United StatesThe economy of the United States is the world's largest national economy. Its nominal GDP was estimated to be nearly $14.5 trillion in 2010, approximately a quarter of nominal global GDP. The European Union has a larger collective economy, but is not a single nation...
- Redistribution of wealth#Public opinion
- Wealth inequality in the United StatesWealth inequality in the United StatesWealth inequality in the United States, also known as the "wealth gap", refers to the unequal distribution of financial assets among residents of the United States. Wealth includes the values of homes, automobiles, businesses, savings, and investments. Those who acquire a great deal of financial...
External links
- Americans Underestimate U.S. Wealth Inequality - audio report by NPRNPRNPR, formerly National Public Radio, is a privately and publicly funded non-profit membership media organization that serves as a national syndicator to a network of 900 public radio stations in the United States. NPR was created in 1970, following congressional passage of the Public Broadcasting...