
Student's t-distribution
Encyclopedia
In probability
and statistics
, Student’s t-distribution (or simply the
t-distribution) is a continuous probability distribution
that arises when estimating the mean
of a normally distributed population
in situations where the sample size
is small and population standard deviation
is unknown. It plays a role in a number of widely-used statistical analyses, including the Student’s t-test
for assessing the statistical significance
of the difference between two sample mean
s, the construction of confidence interval
s for the difference between two population means, and in linear regression analysis
. The Student’s t-distribution also arises in the Bayesian analysis of data from a normal family.
The t-distribution is symmetric and bell-shaped, like the normal distribution, but has heavier tails, meaning that it is more prone to producing values that fall far from its mean. This makes it useful for understanding the statistical behavior of certain types of ratios of random quantities, in which variation in the denominator is amplified and may produce outlying values when the denominator of the ratio falls close to zero. The Student’s t-distribution is a special case of the generalised hyperbolic distribution.
given by
where is the number of degrees of freedom
and is the Gamma function
. This may also be written as
where B is the Beta function.
For even,
even,
For odd,
odd,
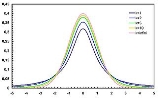
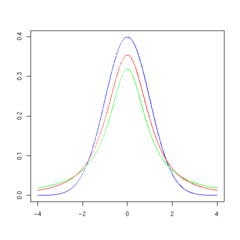
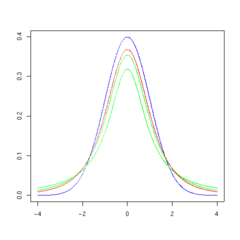
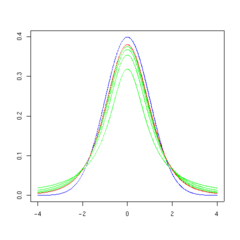
The overall shape of the probability density function of the t-distribution resembles the bell shape of a normally distributed variable with mean 0 and variance 1, except that it is a bit lower and wider. As the number of degrees of freedom grows, the t-distribution approaches the normal distribution with mean 0 and variance 1.
The following images show the density of the t-distribution for increasing values of . The normal distribution is shown as a blue line for comparison. Note that the t-distribution (red line) becomes closer to the normal distribution as
  increases.
can be written in terms of I, the regularized
incomplete beta function. For t > 0,
with

Other values would be obtained by symmetry. An alternative formula, valid for , is
, is
where 2F1 is a particular case of the hypergeometric function.
 give an especially simple form.
The resulting t-value is
(This is not traditionally called a t-statistic unless the value of μ is known. An example is when the value of μ specified by a null hypothesis is used.)
The t-distribution with n − 1 degrees of freedom is the sampling distribution
of the t-value when the samples consist of independent identically distributed observations from a normally distributed population.
while he worked at the Guinness Brewery
in Dublin. One version of the origin of the pseudonym Student, is that Gosset's employer forbade members of its staff from publishing scientific papers, so he had to hide his identity. Another version is that Guinness did not want their competition to know that they were using the t-test to test the quality of raw material. The t-test and the associated theory became well-known through the work of R.A. Fisher, who called the distribution "Student's distribution".
which is the ratio, T, defined as
where
A different distribution is defined as that of the random variable defined, for a given constant μ, by . This random variable has a noncentral t-distribution
with noncentrality parameter
μ. This distribution is important in studies of the power
of Student's t test.
values that are normally distributed with expected value μ and variance
σ2. Let
be the sample mean, and
be an unbiased estimate of the variance from the sample. It can be shown that the random variable
has a chi-squared distribution with n − 1 degrees of freedom (by Cochran's theorem
). It is readily shown that the quantity

is normally distributed with mean 0 and variance 1, since the sample mean is normally distributed with mean
  and variance
  . Moreover, it is possible to show that these two random variables (the normally distributed one and the chi-squared-distributed one) are independent. Consequently the pivotal quantity
,
which differs from Z in that the exact standard deviation σ is replaced by the random variable Sn, has a Student's t-distribution as defined above. Notice that the unknown population variance σ2 does not appear in T, since it was in both the numerator and the denominators, so it canceled. Gosset's work showed that T has the probability density function
stated above, with equal to n − 1.
The distribution of the test statistic, T, depends on , but not μ or σ; the lack of dependence on μ and σ is what makes the t-distribution important in both theory and practice.
for a random variate X for which is fixed.
It should be noted that the term for 0 < k < , k even, may be simplified using the properties of the Gamma function
to
For a t-distribution with degrees of freedom, the expected value
is 0, and its variance
is /(
/( − 2) if
  > 2. The skewness
is 0 if > 3 and the excess kurtosis is 6/(
 − 4) if
  > 4.
> 4.
to uniform
samples; e.g., in the multi-dimensional applications basis of copula-dependency
. In the case of stand-alone sampling, an extension of the Box–Muller method and its polar variation is easily deployed. It has the merit that it applies equally well to all real positive and negative degrees of freedom
.
 is the integral of Student's probability density function, ƒ(t) between −t and t. It thus gives the probability that a value of t less than that calculated from observed data would occur by chance. Therefore, the function
  can be used when testing whether the difference between the means of two sets of data is statistically significant, by calculating the corresponding value of t and the probability of its occurrence if the two sets of data were drawn from the same population. This is used in a variety of situations, particularly in t-tests. For the statistic t, with
  degrees of freedom,
  is the probability that t would be less than the observed value if the two means were the same (provided that the smaller mean is subtracted from the larger, so that t > 0). It is defined for real t by the following formula:
where B is the Beta function. For t > 0, there is a relation to the regularized incomplete beta function Ix(a, b) as follows:
For statistical hypothesis testing this function is used to construct the p-value
.
/scale
family that introduces a location parameter
 and a squared inverse scale parameter
(i.e. precision
) , and has a density defined by
Other properties of this version of the distribution are:
This distribution results from compounding a Gaussian distribution with mean
 and unknown precision
(the reciprocal of the variance
), with a gamma distribution with parameters and
and  . In other words, the random variable X is assumed to have a normal distribution with an unknown precision distributed as gamma, and then this is marginalized over the gamma distribution. (The reason for the usefulness of this characterization is that the gamma distribution is the conjugate prior
distribution of the precision of a Gaussian distribution. As a result, the three-parameter Student's t distribution arises naturally in many Bayesian inference
problems.)
The noncentral t-distribution
is a different way of generalizing the t-distribution to include a location parameter.
at r being proportional to
Here a, b, and k are parameters.
This distribution arises from the construction of a system of discrete distributions similar to that of the Pearson distribution
s for continuous distributions.
. If (as in nearly all practical statistical work) the population standard deviation
of these errors is unknown and has to be estimated from the data, the t-distribution is often used to account for the extra uncertainty that results from this estimation. In most such problems, if the standard deviation of the errors were known, a normal distribution would be used instead of the t-distribution.
Confidence interval
s and hypothesis tests are two statistical procedures in which the quantile
s of the sampling distribution of a particular statistic (e.g. the standard score
) are required. In any situation where this statistic is a linear function
of the data
, divided by the usual estimate of the standard deviation, the resulting quantity can be rescaled and centered to follow Student's t-distribution. Statistical analyses involving means, weighted means, and regression coefficients all lead to statistics having this form.
Quite often, textbook problems will treat the population standard deviation as if it were known and thereby avoid the need to use the Student's t-distribution. These problems are generally of two kinds: (1) those in which the sample size is so large that one may treat a data-based estimate of the variance
as if it were certain, and (2) those that illustrate mathematical reasoning, in which the problem of estimating the standard deviation is temporarily ignored because that is not the point that the author or instructor is then explaining.
that are of interest, so that the t-distribution forms the basis for significance tests. For example, the distribution of Spearman's rank correlation coefficient
ρ, in the null case (zero correlation) is well approximated by the t distribution for sample sizes above about 20 .

when T has a t-distribution with n − 1 degrees of freedom. By symmetry, this is the same as saying that A satisfies

so A is the "95th percentile" of this probability distribution, or . Then
and this is equivalent to
Therefore the interval whose endpoints are

is a 90-percent confidence interval
for μ. Therefore, if we find the mean of a set of observations that we can reasonably expect to have a normal distribution, we can use the t-distribution to examine whether the confidence limits on that mean include some theoretically predicted value - such as the value predicted on a null hypothesis
.
It is this result that is used in the Student's t-test
s: since the difference between the means of samples from two normal distributions is itself distributed normally, the t-distribution can be used to examine whether that difference can reasonably be supposed to be zero.
If the data are normally distributed, the one-sided (1 − a)-upper confidence limit (UCL) of the mean, can be calculated using the following equation:

The resulting UCL will be the greatest average value that will occur for a given confidence interval and population size. In other words, being the mean of the set of observations, the probability that the mean of the distribution is inferior to UCL1−a is equal to the confidence level 1 − a.
for an unobserved sample from a normal distribution with unknown mean and variance.
), and the t-distribution is a natural choice of model for such data and provides a parametric approach to robust statistics
.
Lange et al. explored the use of the t-distribution for robust modeling of heavy tailed data in a variety of contexts. A Bayesian account can be found in Gelman et al. The degrees of freedom parameter controls the kurtosis of the distribution and is correlated with the scale parameter. The likelihood can have multiple local maxima and, as such, it is often necessary to fix the degrees of freedom at a fairly low value and estimate the other parameters taking this as given. Some authors report that values between 3 and 9 are often good choices. Venables and Ripley suggest that a value of 5 is often a good choice.
page supported by R extension can easily give the interactive result of critical values or cumulative probability, even for noncentral t-distribution.
The following table lists a few selected values for t-distributions with degrees of freedom for a range of one-sided or two-sided critical regions. For an example of how to read this table, take the fourth row, which begins with 4; that means
  , the number of degrees of freedom, is 4 (and if we are dealing, as above, with n values with a fixed sum, n = 5). Take the fifth entry, in the column headed 95% for one-sided (90% for two-sided). The value of that entry is "2.132". Then the probability that T is less than 2.132 is 95% or Pr(−∞ < T < 2.132) = 0.95; or mean that Pr(−2.132 < T < 2.132) = 0.9.
This can be calculated by the symmetry of the distribution,
and so
Note that the last row also gives critical points: a t-distribution with infinitely-many degrees of freedom is a normal distribution. (See Related distributions above).
The first column is the number of degrees of freedom.
The number at the beginning of each row in the table above is which has been defined above as n − 1. The percentage along the top is 100%(1 − α). The numbers in the main body of the table are tα,
 . If a quantity T is distributed as a Student's t distribution with
  degrees of freedom, then there is a probability 1 − α that T will be less than tα,
 .(Calculated as for a one-tailed or one-sided test as opposed to a two-tailed test
.)
For example, given a sample with a sample variance 2 and sample mean of 10, taken from a sample set of 11 (10 degrees of freedom), using the formula

We can determine that at 90% confidence, we have a true mean lying below
(In other words, on average, 90% of the times that an upper threshold is calculated by this method, this upper threshold exceeds the true mean.) And, still at 90% confidence, we have a true mean lying over

(In other words, on average, 90% of the times that a lower threshold is calculated by this method, this lower threshold lies below the true mean.) So that at 80% confidence (calculated from 1 − 2 × (1 − 90%) = 80%), we have a true mean lying within the interval

This is generally expressed in interval notation, e.g., for this case, at 80% confidence the true mean is within the interval [9.41490, 10.58510].
(In other words, on average, 80% of the times that upper and lower thresholds are calculated by this method, the true mean is both below the upper threshold and above the lower threshold. This is not the same thing as saying that there is an 80% probability that the true mean lies between a particular pair of upper and lower thresholds that have been calculated by this method—see confidence interval
and prosecutor's fallacy
.)
For information on the inverse cumulative distribution function see Quantile function
.
Probability
Probability is ordinarily used to describe an attitude of mind towards some proposition of whose truth we arenot certain. The proposition of interest is usually of the form "Will a specific event occur?" The attitude of mind is of the form "How certain are we that the event will occur?" The...
and statistics
Statistics
Statistics is the study of the collection, organization, analysis, and interpretation of data. It deals with all aspects of this, including the planning of data collection in terms of the design of surveys and experiments....
, Student’s t-distribution (or simply the
t-distribution) is a continuous probability distribution
Probability distribution
In probability theory, a probability mass, probability density, or probability distribution is a function that describes the probability of a random variable taking certain values....
that arises when estimating the mean
Expected value
In probability theory, the expected value of a random variable is the weighted average of all possible values that this random variable can take on...
of a normally distributed population
Statistical population
A statistical population is a set of entities concerning which statistical inferences are to be drawn, often based on a random sample taken from the population. For example, if we were interested in generalizations about crows, then we would describe the set of crows that is of interest...
in situations where the sample size
Sample size
Sample size determination is the act of choosing the number of observations to include in a statistical sample. The sample size is an important feature of any empirical study in which the goal is to make inferences about a population from a sample...
is small and population standard deviation
Standard deviation
Standard deviation is a widely used measure of variability or diversity used in statistics and probability theory. It shows how much variation or "dispersion" there is from the average...
is unknown. It plays a role in a number of widely-used statistical analyses, including the Student’s t-test
Student's t-test
A t-test is any statistical hypothesis test in which the test statistic follows a Student's t distribution if the null hypothesis is supported. It is most commonly applied when the test statistic would follow a normal distribution if the value of a scaling term in the test statistic were known...
for assessing the statistical significance
Statistical significance
In statistics, a result is called statistically significant if it is unlikely to have occurred by chance. The phrase test of significance was coined by Ronald Fisher....
of the difference between two sample mean
Mean
In statistics, mean has two related meanings:* the arithmetic mean .* the expected value of a random variable, which is also called the population mean....
s, the construction of confidence interval
Confidence interval
In statistics, a confidence interval is a particular kind of interval estimate of a population parameter and is used to indicate the reliability of an estimate. It is an observed interval , in principle different from sample to sample, that frequently includes the parameter of interest, if the...
s for the difference between two population means, and in linear regression analysis
Regression analysis
In statistics, regression analysis includes many techniques for modeling and analyzing several variables, when the focus is on the relationship between a dependent variable and one or more independent variables...
. The Student’s t-distribution also arises in the Bayesian analysis of data from a normal family.
The t-distribution is symmetric and bell-shaped, like the normal distribution, but has heavier tails, meaning that it is more prone to producing values that fall far from its mean. This makes it useful for understanding the statistical behavior of certain types of ratios of random quantities, in which variation in the denominator is amplified and may produce outlying values when the denominator of the ratio falls close to zero. The Student’s t-distribution is a special case of the generalised hyperbolic distribution.
Probability density function
Student's t-distribution has the probability density functionProbability density function
In probability theory, a probability density function , or density of a continuous random variable is a function that describes the relative likelihood for this random variable to occur at a given point. The probability for the random variable to fall within a particular region is given by the...
given by
where
is the number of degrees of freedomDegrees of freedom (statistics)
In statistics, the number of degrees of freedom is the number of values in the final calculation of a statistic that are free to vary.Estimates of statistical parameters can be based upon different amounts of information or data. The number of independent pieces of information that go into the...
and
is the Gamma functionGamma function
In mathematics, the gamma function is an extension of the factorial function, with its argument shifted down by 1, to real and complex numbers...
. This may also be written as
where B is the Beta function.
For
even,
For
odd,
The overall shape of the probability density function of the t-distribution resembles the bell shape of a normally distributed variable with mean 0 and variance 1, except that it is a bit lower and wider. As the number of degrees of freedom grows, the t-distribution approaches the normal distribution with mean 0 and variance 1.
The following images show the density of the t-distribution for increasing values of
. The normal distribution is shown as a blue line for comparison. Note that the t-distribution (red line) becomes closer to the normal distribution as increases. 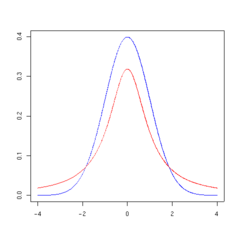 |
 |
 |
 |
 |
 |
Cumulative distribution function
The cumulative distribution functionCumulative distribution function
In probability theory and statistics, the cumulative distribution function , or just distribution function, describes the probability that a real-valued random variable X with a given probability distribution will be found at a value less than or equal to x. Intuitively, it is the "area so far"...
can be written in terms of I, the regularized
incomplete beta function. For t > 0,
with
Other values would be obtained by symmetry. An alternative formula, valid for
, iswhere 2F1 is a particular case of the hypergeometric function.
Special cases
Certain values of give an especially simple form.
- Distribution function:
- Density function:

- See Cauchy distributionCauchy distributionThe Cauchy–Lorentz distribution, named after Augustin Cauchy and Hendrik Lorentz, is a continuous probability distribution. As a probability distribution, it is known as the Cauchy distribution, while among physicists, it is known as the Lorentz distribution, Lorentz function, or Breit–Wigner...

- Distribution function:
- Density function:


- Density function:
How the t-distribution arises
Let x1, ..., xn be the numbers observed in a sample from a continuously distributed population with expected value μ. The sample mean and sample variance are respectively
The resulting t-value is

(This is not traditionally called a t-statistic unless the value of μ is known. An example is when the value of μ specified by a null hypothesis is used.)
The t-distribution with n − 1 degrees of freedom is the sampling distribution
Sampling distribution
In statistics, a sampling distribution or finite-sample distribution is the probability distribution of a given statistic based on a random sample. Sampling distributions are important in statistics because they provide a major simplification on the route to statistical inference...
of the t-value when the samples consist of independent identically distributed observations from a normally distributed population.
History and etymology
In statistics, the t-distribution was first derived as a posterior distribution by Helmert and Lüroth. In the English literature, a derivation of the t-distribution was published in 1908 by William Sealy GossetWilliam Sealy Gosset
William Sealy Gosset is famous as a statistician, best known by his pen name Student and for his work on Student's t-distribution....
while he worked at the Guinness Brewery
St. James's Gate Brewery
St. James's Gate Brewery is a brewery founded in 1759 in Dublin, Ireland by Arthur Guinness. The company is now a part of Diageo, a company formed via the merger of Guinness and Grand Metropolitan in 1997. The main product produced at the brewery is Guinness Draft.Leased for 9,000 years in 1759 by...
in Dublin. One version of the origin of the pseudonym Student, is that Gosset's employer forbade members of its staff from publishing scientific papers, so he had to hide his identity. Another version is that Guinness did not want their competition to know that they were using the t-test to test the quality of raw material. The t-test and the associated theory became well-known through the work of R.A. Fisher, who called the distribution "Student's distribution".
As the distribution of a test statistic
Student's t-distribution can be defined as being the distribution of the random variableRandom variable
In probability and statistics, a random variable or stochastic variable is, roughly speaking, a variable whose value results from a measurement on some type of random process. Formally, it is a function from a probability space, typically to the real numbers, which is measurable functionmeasurable...
which is the ratio, T, defined as
where
- Z is normally distributed with expected valueExpected valueIn probability theory, the expected value of a random variable is the weighted average of all possible values that this random variable can take on...
0 and variance 1; - V has a chi-squared distribution with
 ("nu") degrees of freedomDegrees of freedom (statistics)In statistics, the number of degrees of freedom is the number of values in the final calculation of a statistic that are free to vary.Estimates of statistical parameters can be based upon different amounts of information or data. The number of independent pieces of information that go into the...
; - Z and V are independentStatistical independenceIn probability theory, to say that two events are independent intuitively means that the occurrence of one event makes it neither more nor less probable that the other occurs...
.
A different distribution is defined as that of the random variable defined, for a given constant μ, by
. This random variable has a noncentral t-distributionNoncentral t-distribution
In probability and statistics, the noncentral t-distribution generalizes Student's t-distribution using a noncentrality parameter. Like the central t-distribution, the noncentral t-distribution is primarily used in statistical inference, although it may also be used in robust modeling for data...
with noncentrality parameter
Noncentrality parameter
Noncentrality parameters are parameters of families of probability distributions which are related to other "central" families of distributions. If the noncentrality parameter of a distribution is zero, the distribution is identical to a distribution in the central family...
μ. This distribution is important in studies of the power
Statistical power
The power of a statistical test is the probability that the test will reject the null hypothesis when the null hypothesis is actually false . The power is in general a function of the possible distributions, often determined by a parameter, under the alternative hypothesis...
of Student's t test.
Derivation
Suppose X1, ..., Xn are independentStatistical independence
In probability theory, to say that two events are independent intuitively means that the occurrence of one event makes it neither more nor less probable that the other occurs...
values that are normally distributed with expected value μ and variance
Variance
In probability theory and statistics, the variance is a measure of how far a set of numbers is spread out. It is one of several descriptors of a probability distribution, describing how far the numbers lie from the mean . In particular, the variance is one of the moments of a distribution...
σ2. Let
be the sample mean, and
be an unbiased estimate of the variance from the sample. It can be shown that the random variable

has a chi-squared distribution with n − 1 degrees of freedom (by Cochran's theorem
Cochran's theorem
In statistics, Cochran's theorem, devised by William G. Cochran, is a theorem used in to justify results relating to the probability distributions of statistics that are used in the analysis of variance.- Statement :...
). It is readily shown that the quantity
is normally distributed with mean 0 and variance 1, since the sample mean
is normally distributed with mean and variance . Moreover, it is possible to show that these two random variables (the normally distributed one and the chi-squared-distributed one) are independent. Consequently the pivotal quantityPivotal quantity
In statistics, a pivotal quantity or pivot is a function of observations and unobservable parameters whose probability distribution does not depend on unknown parameters....
,
which differs from Z in that the exact standard deviation σ is replaced by the random variable Sn, has a Student's t-distribution as defined above. Notice that the unknown population variance σ2 does not appear in T, since it was in both the numerator and the denominators, so it canceled. Gosset's work showed that T has the probability density function
Probability density function
In probability theory, a probability density function , or density of a continuous random variable is a function that describes the relative likelihood for this random variable to occur at a given point. The probability for the random variable to fall within a particular region is given by the...
stated above, with
equal to n − 1.The distribution of the test statistic, T, depends on
, but not μ or σ; the lack of dependence on μ and σ is what makes the t-distribution important in both theory and practice.As a maximum entropy distribution
Student's t-distribution is the maximum entropy probability distributionMaximum entropy probability distribution
In statistics and information theory, a maximum entropy probability distribution is a probability distribution whose entropy is at least as great as that of all other members of a specified class of distributions....
for a random variate X for which
is fixed.Moments
The moments of the t-distribution areIt should be noted that the term for 0 < k <
, k even, may be simplified using the properties of the Gamma functionGamma function
In mathematics, the gamma function is an extension of the factorial function, with its argument shifted down by 1, to real and complex numbers...
to
For a t-distribution with
degrees of freedom, the expected valueExpected value
In probability theory, the expected value of a random variable is the weighted average of all possible values that this random variable can take on...
is 0, and its variance
Variance
In probability theory and statistics, the variance is a measure of how far a set of numbers is spread out. It is one of several descriptors of a probability distribution, describing how far the numbers lie from the mean . In particular, the variance is one of the moments of a distribution...
is
/( − 2) if > 2. The skewnessSkewness
In probability theory and statistics, skewness is a measure of the asymmetry of the probability distribution of a real-valued random variable. The skewness value can be positive or negative, or even undefined...
is 0 if
> 3 and the excess kurtosis is 6/( − 4) if > 4.Relation to F distribution
 has an F-distribution if
  and
and  has a Student's t-distribution.
Monte Carlo sampling
There are various approaches to constructing random samples from the Student-t distribution. The matter depends on whether the samples are required on a stand-alone basis, or are to be constructed by application of a quantile functionQuantile function
In probability and statistics, the quantile function of the probability distribution of a random variable specifies, for a given probability, the value which the random variable will be at, or below, with that probability...
to uniform
Uniform
A uniform is a set of standard clothing worn by members of an organization while participating in that organization's activity. Modern uniforms are worn by armed forces and paramilitary organizations such as police, emergency services, security guards, in some workplaces and schools and by inmates...
samples; e.g., in the multi-dimensional applications basis of copula-dependency
Copula (statistics)
In probability theory and statistics, a copula can be used to describe the dependence between random variables. Copulas derive their name from linguistics....
. In the case of stand-alone sampling, an extension of the Box–Muller method and its polar variation is easily deployed. It has the merit that it applies equally well to all real positive and negative degrees of freedom
Degrees of freedom
Degrees of freedom can mean:* Degrees of freedom , independent displacements and/or rotations that specify the orientation of the body or system...
.
Integral of Student's probability density function and p-value
The function is the integral of Student's probability density function, ƒ(t) between −t and t. It thus gives the probability that a value of t less than that calculated from observed data would occur by chance. Therefore, the function can be used when testing whether the difference between the means of two sets of data is statistically significant, by calculating the corresponding value of t and the probability of its occurrence if the two sets of data were drawn from the same population. This is used in a variety of situations, particularly in t-tests. For the statistic t, with degrees of freedom, is the probability that t would be less than the observed value if the two means were the same (provided that the smaller mean is subtracted from the larger, so that t > 0). It is defined for real t by the following formula:where B is the Beta function. For t > 0, there is a relation to the regularized incomplete beta function Ix(a, b) as follows:
For statistical hypothesis testing this function is used to construct the p-value
P-value
In statistical significance testing, the p-value is the probability of obtaining a test statistic at least as extreme as the one that was actually observed, assuming that the null hypothesis is true. One often "rejects the null hypothesis" when the p-value is less than the significance level α ,...
.
Three-parameter version
Student's t distribution can be generalized to a three parameter locationLocation parameter
In statistics, a location family is a class of probability distributions that is parametrized by a scalar- or vector-valued parameter μ, which determines the "location" or shift of the distribution...
/scale
Scale parameter
In probability theory and statistics, a scale parameter is a special kind of numerical parameter of a parametric family of probability distributions...
family that introduces a location parameter
Location parameter
In statistics, a location family is a class of probability distributions that is parametrized by a scalar- or vector-valued parameter μ, which determines the "location" or shift of the distribution...
and a squared inverse scale parameterScale parameter
In probability theory and statistics, a scale parameter is a special kind of numerical parameter of a parametric family of probability distributions...
(i.e. precision
Precision (statistics)
In statistics, the term precision can mean a quantity defined in a specific way. This is in addition to its more general meaning in the contexts of accuracy and precision and of precision and recall....
)
, and has a density defined byOther properties of this version of the distribution are:
This distribution results from compounding a Gaussian distribution with mean
Mean
In statistics, mean has two related meanings:* the arithmetic mean .* the expected value of a random variable, which is also called the population mean....
and unknown precisionPrecision (statistics)
In statistics, the term precision can mean a quantity defined in a specific way. This is in addition to its more general meaning in the contexts of accuracy and precision and of precision and recall....
(the reciprocal of the variance
Variance
In probability theory and statistics, the variance is a measure of how far a set of numbers is spread out. It is one of several descriptors of a probability distribution, describing how far the numbers lie from the mean . In particular, the variance is one of the moments of a distribution...
), with a gamma distribution with parameters
and . In other words, the random variable X is assumed to have a normal distribution with an unknown precision distributed as gamma, and then this is marginalized over the gamma distribution. (The reason for the usefulness of this characterization is that the gamma distribution is the conjugate priorConjugate prior
In Bayesian probability theory, if the posterior distributions p are in the same family as the prior probability distribution p, the prior and posterior are then called conjugate distributions, and the prior is called a conjugate prior for the likelihood...
distribution of the precision of a Gaussian distribution. As a result, the three-parameter Student's t distribution arises naturally in many Bayesian inference
Bayesian inference
In statistics, Bayesian inference is a method of statistical inference. It is often used in science and engineering to determine model parameters, make predictions about unknown variables, and to perform model selection...
problems.)
The noncentral t-distribution
Noncentral t-distribution
In probability and statistics, the noncentral t-distribution generalizes Student's t-distribution using a noncentrality parameter. Like the central t-distribution, the noncentral t-distribution is primarily used in statistical inference, although it may also be used in robust modeling for data...
is a different way of generalizing the t-distribution to include a location parameter.
Discrete version
The "discrete Student's t distribution" is defined by its probability mass functionProbability mass function
In probability theory and statistics, a probability mass function is a function that gives the probability that a discrete random variable is exactly equal to some value...
at r being proportional to
Here a, b, and k are parameters.
This distribution arises from the construction of a system of discrete distributions similar to that of the Pearson distribution
Pearson distribution
The Pearson distribution is a family of continuous probability distributions. It was first published by Karl Pearson in 1895 and subsequently extended by him in 1901 and 1916 in a series of articles on biostatistics.- History :...
s for continuous distributions.
In frequentist statistical inference
Student's t-distribution arises in a variety of statistical estimation problems where the goal is to estimate an unknown parameter, such as a mean value, in a setting where the data are observed with additive errorsErrors and residuals in statistics
In statistics and optimization, statistical errors and residuals are two closely related and easily confused measures of the deviation of a sample from its "theoretical value"...
. If (as in nearly all practical statistical work) the population standard deviation
Standard deviation
Standard deviation is a widely used measure of variability or diversity used in statistics and probability theory. It shows how much variation or "dispersion" there is from the average...
of these errors is unknown and has to be estimated from the data, the t-distribution is often used to account for the extra uncertainty that results from this estimation. In most such problems, if the standard deviation of the errors were known, a normal distribution would be used instead of the t-distribution.
Confidence interval
Confidence interval
In statistics, a confidence interval is a particular kind of interval estimate of a population parameter and is used to indicate the reliability of an estimate. It is an observed interval , in principle different from sample to sample, that frequently includes the parameter of interest, if the...
s and hypothesis tests are two statistical procedures in which the quantile
Quantile
Quantiles are points taken at regular intervals from the cumulative distribution function of a random variable. Dividing ordered data into q essentially equal-sized data subsets is the motivation for q-quantiles; the quantiles are the data values marking the boundaries between consecutive subsets...
s of the sampling distribution of a particular statistic (e.g. the standard score
Standard score
In statistics, a standard score indicates how many standard deviations an observation or datum is above or below the mean. It is a dimensionless quantity derived by subtracting the population mean from an individual raw score and then dividing the difference by the population standard deviation...
) are required. In any situation where this statistic is a linear function
Linear function
In mathematics, the term linear function can refer to either of two different but related concepts:* a first-degree polynomial function of one variable;* a map between two vector spaces that preserves vector addition and scalar multiplication....
of the data
Data
The term data refers to qualitative or quantitative attributes of a variable or set of variables. Data are typically the results of measurements and can be the basis of graphs, images, or observations of a set of variables. Data are often viewed as the lowest level of abstraction from which...
, divided by the usual estimate of the standard deviation, the resulting quantity can be rescaled and centered to follow Student's t-distribution. Statistical analyses involving means, weighted means, and regression coefficients all lead to statistics having this form.
Quite often, textbook problems will treat the population standard deviation as if it were known and thereby avoid the need to use the Student's t-distribution. These problems are generally of two kinds: (1) those in which the sample size is so large that one may treat a data-based estimate of the variance
Variance
In probability theory and statistics, the variance is a measure of how far a set of numbers is spread out. It is one of several descriptors of a probability distribution, describing how far the numbers lie from the mean . In particular, the variance is one of the moments of a distribution...
as if it were certain, and (2) those that illustrate mathematical reasoning, in which the problem of estimating the standard deviation is temporarily ignored because that is not the point that the author or instructor is then explaining.
Hypothesis testing
A number of statistics can be shown to have t-distributions for samples of moderate size under null hypothesesNull hypothesis
The practice of science involves formulating and testing hypotheses, assertions that are capable of being proven false using a test of observed data. The null hypothesis typically corresponds to a general or default position...
that are of interest, so that the t-distribution forms the basis for significance tests. For example, the distribution of Spearman's rank correlation coefficient
Spearman's rank correlation coefficient
In statistics, Spearman's rank correlation coefficient or Spearman's rho, named after Charles Spearman and often denoted by the Greek letter \rho or as r_s, is a non-parametric measure of statistical dependence between two variables. It assesses how well the relationship between two variables can...
ρ, in the null case (zero correlation) is well approximated by the t distribution for sample sizes above about 20 .
Confidence intervals
Suppose the number A is so chosen thatwhen T has a t-distribution with n − 1 degrees of freedom. By symmetry, this is the same as saying that A satisfies
so A is the "95th percentile" of this probability distribution, or
. Thenand this is equivalent to
Therefore the interval whose endpoints are
is a 90-percent confidence interval
Confidence interval
In statistics, a confidence interval is a particular kind of interval estimate of a population parameter and is used to indicate the reliability of an estimate. It is an observed interval , in principle different from sample to sample, that frequently includes the parameter of interest, if the...
for μ. Therefore, if we find the mean of a set of observations that we can reasonably expect to have a normal distribution, we can use the t-distribution to examine whether the confidence limits on that mean include some theoretically predicted value - such as the value predicted on a null hypothesis
Null hypothesis
The practice of science involves formulating and testing hypotheses, assertions that are capable of being proven false using a test of observed data. The null hypothesis typically corresponds to a general or default position...
.
It is this result that is used in the Student's t-test
Student's t-test
A t-test is any statistical hypothesis test in which the test statistic follows a Student's t distribution if the null hypothesis is supported. It is most commonly applied when the test statistic would follow a normal distribution if the value of a scaling term in the test statistic were known...
s: since the difference between the means of samples from two normal distributions is itself distributed normally, the t-distribution can be used to examine whether that difference can reasonably be supposed to be zero.
If the data are normally distributed, the one-sided (1 − a)-upper confidence limit (UCL) of the mean, can be calculated using the following equation:
The resulting UCL will be the greatest average value that will occur for a given confidence interval and population size. In other words,
being the mean of the set of observations, the probability that the mean of the distribution is inferior to UCL1−a is equal to the confidence level 1 − a.Prediction intervals
The t-distribution can be used to construct a prediction intervalPrediction interval
In statistical inference, specifically predictive inference, a prediction interval is an estimate of an interval in which future observations will fall, with a certain probability, given what has already been observed...
for an unobserved sample from a normal distribution with unknown mean and variance.
Robust parametric modeling
The t-distribution is often used as an alternative to the normal distribution as a model for data. It is frequently the case that real data have heavier tails than the normal distribution allows for. The classical approach was to identify outliers and exclude or downweight them in some way. However, it is not always easy to identify outliers (especially in high dimensionsCurse of dimensionality
The curse of dimensionality refers to various phenomena that arise when analyzing and organizing high-dimensional spaces that do not occur in low-dimensional settings such as the physical space commonly modeled with just three dimensions.There are multiple phenomena referred to by this name in...
), and the t-distribution is a natural choice of model for such data and provides a parametric approach to robust statistics
Robust statistics
Robust statistics provides an alternative approach to classical statistical methods. The motivation is to produce estimators that are not unduly affected by small departures from model assumptions.- Introduction :...
.
Lange et al. explored the use of the t-distribution for robust modeling of heavy tailed data in a variety of contexts. A Bayesian account can be found in Gelman et al. The degrees of freedom parameter controls the kurtosis of the distribution and is correlated with the scale parameter. The likelihood can have multiple local maxima and, as such, it is often necessary to fix the degrees of freedom at a fairly low value and estimate the other parameters taking this as given. Some authors report that values between 3 and 9 are often good choices. Venables and Ripley suggest that a value of 5 is often a good choice.
Table of selected values
Most statistical textbooks list t distribution tables. Nowadays, the better way to a fully precise critical t value or a cumulative probability is the statistical function implemented in spreadsheets (Office Excel, OpenOffice Calc, etc.), or an interactive calculating web page. The relevant spreadsheet functions are TDIST and TINV, while online calculating pages save troubles like positions of parameters or names of functions. For example, a MediawikiMediaWiki
MediaWiki is a popular free web-based wiki software application. Developed by the Wikimedia Foundation, it is used to run all of its projects, including Wikipedia, Wiktionary and Wikinews. Numerous other wikis around the world also use it to power their websites...
page supported by R extension can easily give the interactive result of critical values or cumulative probability, even for noncentral t-distribution.
The following table lists a few selected values for t-distributions with
degrees of freedom for a range of one-sided or two-sided critical regions. For an example of how to read this table, take the fourth row, which begins with 4; that means , the number of degrees of freedom, is 4 (and if we are dealing, as above, with n values with a fixed sum, n = 5). Take the fifth entry, in the column headed 95% for one-sided (90% for two-sided). The value of that entry is "2.132". Then the probability that T is less than 2.132 is 95% or Pr(−∞ < T < 2.132) = 0.95; or mean that Pr(−2.132 < T < 2.132) = 0.9.This can be calculated by the symmetry of the distribution,
- Pr(T < −2.132) = 1 − Pr(T > −2.132) = 1 − 0.95 = 0.05,
and so
- Pr(−2.132 < T < 2.132) = 1 − 2(0.05) = 0.9.
Note that the last row also gives critical points: a t-distribution with infinitely-many degrees of freedom is a normal distribution. (See Related distributions above).
The first column is the number of degrees of freedom.
| One Sided | 75% | 80% | 85% | 90% | 95% | 97.5% | 99% | 99.5% | 99.75% | 99.9% | 99.95% |
|---|---|---|---|---|---|---|---|---|---|---|---|
| Two Sided | 50% | 60% | 70% | 80% | 90% | 95% | 98% | 99% | 99.5% | 99.8% | 99.9% |
| 1 | 1.000 | 1.376 | 1.963 | 3.078 | 6.314 | 12.71 | 31.82 | 63.66 | 127.3 | 318.3 | 636.6 |
| 2 | 0.816 | 1.061 | 1.386 | 1.886 | 2.920 | 4.303 | 6.965 | 9.925 | 14.09 | 22.33 | 31.60 |
| 3 | 0.765 | 0.978 | 1.250 | 1.638 | 2.353 | 3.182 | 4.541 | 5.841 | 7.453 | 10.21 | 12.92 |
| 4 | 0.741 | 0.941 | 1.190 | 1.533 | 2.132 | 2.776 | 3.747 | 4.604 | 5.598 | 7.173 | 8.610 |
| 5 | 0.727 | 0.920 | 1.156 | 1.476 | 2.015 | 2.571 | 3.365 | 4.032 | 4.773 | 5.893 | 6.869 |
| 6 | 0.718 | 0.906 | 1.134 | 1.440 | 1.943 | 2.447 | 3.143 | 3.707 | 4.317 | 5.208 | 5.959 |
| 7 | 0.711 | 0.896 | 1.119 | 1.415 | 1.895 | 2.365 | 2.998 | 3.499 | 4.029 | 4.785 | 5.408 |
| 8 | 0.706 | 0.889 | 1.108 | 1.397 | 1.860 | 2.306 | 2.896 | 3.355 | 3.833 | 4.501 | 5.041 |
| 9 | 0.703 | 0.883 | 1.100 | 1.383 | 1.833 | 2.262 | 2.821 | 3.250 | 3.690 | 4.297 | 4.781 |
| 10 | 0.700 | 0.879 | 1.093 | 1.372 | 1.812 | 2.228 | 2.764 | 3.169 | 3.581 | 4.144 | 4.587 |
| 11 | 0.697 | 0.876 | 1.088 | 1.363 | 1.796 | 2.201 | 2.718 | 3.106 | 3.497 | 4.025 | 4.437 |
| 12 | 0.695 | 0.873 | 1.083 | 1.356 | 1.782 | 2.179 | 2.681 | 3.055 | 3.428 | 3.930 | 4.318 |
| 13 | 0.694 | 0.870 | 1.079 | 1.350 | 1.771 | 2.160 | 2.650 | 3.012 | 3.372 | 3.852 | 4.221 |
| 14 | 0.692 | 0.868 | 1.076 | 1.345 | 1.761 | 2.145 | 2.624 | 2.977 | 3.326 | 3.787 | 4.140 |
| 15 | 0.691 | 0.866 | 1.074 | 1.341 | 1.753 | 2.131 | 2.602 | 2.947 | 3.286 | 3.733 | 4.073 |
| 16 | 0.690 | 0.865 | 1.071 | 1.337 | 1.746 | 2.120 | 2.583 | 2.921 | 3.252 | 3.686 | 4.015 |
| 17 | 0.689 | 0.863 | 1.069 | 1.333 | 1.740 | 2.110 | 2.567 | 2.898 | 3.222 | 3.646 | 3.965 |
| 18 | 0.688 | 0.862 | 1.067 | 1.330 | 1.734 | 2.101 | 2.552 | 2.878 | 3.197 | 3.610 | 3.922 |
| 19 | 0.688 | 0.861 | 1.066 | 1.328 | 1.729 | 2.093 | 2.539 | 2.861 | 3.174 | 3.579 | 3.883 |
| 20 | 0.687 | 0.860 | 1.064 | 1.325 | 1.725 | 2.086 | 2.528 | 2.845 | 3.153 | 3.552 | 3.850 |
| 21 | 0.686 | 0.859 | 1.063 | 1.323 | 1.721 | 2.080 | 2.518 | 2.831 | 3.135 | 3.527 | 3.819 |
| 22 | 0.686 | 0.858 | 1.061 | 1.321 | 1.717 | 2.074 | 2.508 | 2.819 | 3.119 | 3.505 | 3.792 |
| 23 | 0.685 | 0.858 | 1.060 | 1.319 | 1.714 | 2.069 | 2.500 | 2.807 | 3.104 | 3.485 | 3.767 |
| 24 | 0.685 | 0.857 | 1.059 | 1.318 | 1.711 | 2.064 | 2.492 | 2.797 | 3.091 | 3.467 | 3.745 |
| 25 | 0.684 | 0.856 | 1.058 | 1.316 | 1.708 | 2.060 | 2.485 | 2.787 | 3.078 | 3.450 | 3.725 |
| 26 | 0.684 | 0.856 | 1.058 | 1.315 | 1.706 | 2.056 | 2.479 | 2.779 | 3.067 | 3.435 | 3.707 |
| 27 | 0.684 | 0.855 | 1.057 | 1.314 | 1.703 | 2.052 | 2.473 | 2.771 | 3.057 | 3.421 | 3.690 |
| 28 | 0.683 | 0.855 | 1.056 | 1.313 | 1.701 | 2.048 | 2.467 | 2.763 | 3.047 | 3.408 | 3.674 |
| 29 | 0.683 | 0.854 | 1.055 | 1.311 | 1.699 | 2.045 | 2.462 | 2.756 | 3.038 | 3.396 | 3.659 |
| 30 | 0.683 | 0.854 | 1.055 | 1.310 | 1.697 | 2.042 | 2.457 | 2.750 | 3.030 | 3.385 | 3.646 |
| 40 | 0.681 | 0.851 | 1.050 | 1.303 | 1.684 | 2.021 | 2.423 | 2.704 | 2.971 | 3.307 | 3.551 |
| 50 | 0.679 | 0.849 | 1.047 | 1.299 | 1.676 | 2.009 | 2.403 | 2.678 | 2.937 | 3.261 | 3.496 |
| 60 | 0.679 | 0.848 | 1.045 | 1.296 | 1.671 | 2.000 | 2.390 | 2.660 | 2.915 | 3.232 | 3.460 |
| 80 | 0.678 | 0.846 | 1.043 | 1.292 | 1.664 | 1.990 | 2.374 | 2.639 | 2.887 | 3.195 | 3.416 |
| 100 | 0.677 | 0.845 | 1.042 | 1.290 | 1.660 | 1.984 | 2.364 | 2.626 | 2.871 | 3.174 | 3.390 |
| 120 | 0.677 | 0.845 | 1.041 | 1.289 | 1.658 | 1.980 | 2.358 | 2.617 | 2.860 | 3.160 | 3.373 |
 |
0.674 | 0.842 | 1.036 | 1.282 | 1.645 | 1.960 | 2.326 | 2.576 | 2.807 | 3.090 | 3.291 |
The number at the beginning of each row in the table above is
which has been defined above as n − 1. The percentage along the top is 100%(1 − α). The numbers in the main body of the table are tα,. If a quantity T is distributed as a Student's t distribution with degrees of freedom, then there is a probability 1 − α that T will be less than tα,.(Calculated as for a one-tailed or one-sided test as opposed to a two-tailed testTwo-tailed test
The two-tailed test is a statistical test used in inference, in which a given statistical hypothesis, H0 , will be rejected when the value of the test statistic is either sufficiently small or sufficiently large...
.)
For example, given a sample with a sample variance 2 and sample mean of 10, taken from a sample set of 11 (10 degrees of freedom), using the formula
We can determine that at 90% confidence, we have a true mean lying below
(In other words, on average, 90% of the times that an upper threshold is calculated by this method, this upper threshold exceeds the true mean.) And, still at 90% confidence, we have a true mean lying over
(In other words, on average, 90% of the times that a lower threshold is calculated by this method, this lower threshold lies below the true mean.) So that at 80% confidence (calculated from 1 − 2 × (1 − 90%) = 80%), we have a true mean lying within the interval
This is generally expressed in interval notation, e.g., for this case, at 80% confidence the true mean is within the interval [9.41490, 10.58510].
(In other words, on average, 80% of the times that upper and lower thresholds are calculated by this method, the true mean is both below the upper threshold and above the lower threshold. This is not the same thing as saying that there is an 80% probability that the true mean lies between a particular pair of upper and lower thresholds that have been calculated by this method—see confidence interval
Confidence interval
In statistics, a confidence interval is a particular kind of interval estimate of a population parameter and is used to indicate the reliability of an estimate. It is an observed interval , in principle different from sample to sample, that frequently includes the parameter of interest, if the...
and prosecutor's fallacy
Prosecutor's fallacy
The prosecutor's fallacy is a fallacy of statistical reasoning made in law where the context in which the accused has been brought to court is falsely assumed to be irrelevant to judging how confident a jury can be in evidence against them with a statistical measure of doubt...
.)
For information on the inverse cumulative distribution function see Quantile function
Quantile function
In probability and statistics, the quantile function of the probability distribution of a random variable specifies, for a given probability, the value which the random variable will be at, or below, with that probability...
.
See also
- Student's t-statisticStudent's t-statisticIn statistics, the t-statistic is a ratio of the departure of an estimated parameter from its notional value and its standard error. It is used in hypothesis testing, for example in the Student's t-test, in the augmented Dickey–Fuller test, and in bootstrapping.-Definition:Let \scriptstyle\hat\beta...
- Hotelling's T-squared distribution
- Multivariate Student distribution
External links
- Earliest Known Uses of Some of the Words of Mathematics (S) (Remarks on the history of the term "Student's distribution")