
Statistical parametric mapping
Encyclopedia
Statistical parametric mapping or SPM is a statistical technique created by Karl Friston for examining differences in brain
activity recorded during functional neuroimaging
experiments using neuroimaging
technologies such as fMRI
or PET
. It may also refer to a specific piece of software created by the Wellcome Department of Imaging Neuroscience (part of University College London
) to carry out such analyses.
for examples). Regardless of which technology is used, the scanner produces a 'map' of the area being scanned that is represented as voxel
s. Each voxel typically represents the activity of a particular coordinate in three dimensional space. The exact size of a voxel will vary depending on the technology used, although fMRI voxels typically represent a volume of 27 mm3 (a cube with 3mm length sides).
To accommodate these random effects, and to highlight the areas of activity linked specifically to the process under investigation, statistics are used to look for the most significant difference above and beyond background brain activity. This involves a multi-stage process to prepare the data, and to subsequently analyse it using a statistical method known as the general linear model
.
A study will usually scan a subject several times. To account for the motion of the head between scans, the images will usually be adjusted so each of the voxels in the images corresponds (approximately) to the same site in the brain. This is referred to as realignment or motion correction, see image realignment.
Functional neuroimaging studies usually involve several participants, who will have slightly differently shaped brains. All are likely to have the same gross anatomy, but there will be minor differences in overall brain size, individual variation in topography of the gyri and sulci
of the cerebral cortex
, and morphological differences in deep structures such as the corpus callosum
. To aid comparisons, the 3D image of each brain is transformed so that superficial structures line up, a process known as spatial normalization
. Such normalization typically involves not only translation and rotation, but also scaling and nonlinear warping of the brain surface to match a standard template. Standard brain maps such as the Talairach-Tournoux or templates from the Montréal Neurological Institute
(MNI) are often used to allow researchers from across the world to compare their results.
Images are often smoothed (similar to the 'blur' effect used in some image-editing software) by which voxels are averaged with their neighbours, typically using a Gaussian
filter or by wavelet
transformation, to make the data less noisy.
models are assumed at each voxel, using the general linear model
to describe the variability in the data in terms of experimental and confounding effects, and residual variability. Hypotheses expressed in terms of the model parameters are assessed at each voxel with univariate statistics.
Analyses may also be conducted to examine differences over a time series
(i.e correlations between a task variable and brain activity in a certain area) using linear convolution
models of how the measured signal is caused by underlying changes in neural activity.
Because many statistical tests are being conducted, adjustments have to be made to control for Type I errors (false positives) potentially caused by the comparison of levels of activity at a large number of voxels. In this case, a Type I error would result in falsely detecting background brain activity as activity related to the task. Adjustments are made, based on the number of resel
s in the image and the theory of continuous random field
s in order to set a new criterion for statistical significance that adjusts for the problem of multiple comparisons
.
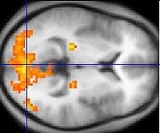
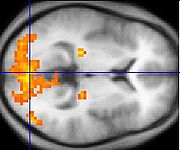
Most simply, they can be presented as a table, displaying coordinates that show the most significant differences in activity between tasks. However, differences in brain activity are more often shown as patches of colour on an MRI brain 'slice', with the colours representing the location of voxels that have shown statistically significant differences between conditions. The gradient of color is mapped to statistical values, such as t-values or z-scores. This creates an intuitive and visually appealing means of delineating the relative statistical strength of a given area of activation. Recently, an alternative approach has been suggested, in which the statistical map is combined with the map of the original difference in brain activity (or, more generally speaking, with the original contrast) and colorcodes are attributed to the latter.
Differences in activity may also be represented as a 'glass brain', a representation of three outline views of the brain as if it were transparent. Only the patches of activation are visible as areas of shading. This is useful as a quick means of summarizing the total area of significant change in a given statistical comparison.
 >
>
to aid in the analysis of functional neuroimaging data. It is written using MATLAB
and is distributed as free software
.
Brain
The brain is the center of the nervous system in all vertebrate and most invertebrate animals—only a few primitive invertebrates such as sponges, jellyfish, sea squirts and starfishes do not have one. It is located in the head, usually close to primary sensory apparatus such as vision, hearing,...
activity recorded during functional neuroimaging
Functional neuroimaging
Functional neuroimaging is the use of neuroimaging technology to measure an aspect of brain function, often with a view to understanding the relationship between activity in certain brain areas and specific mental functions...
experiments using neuroimaging
Neuroimaging
Neuroimaging includes the use of various techniques to either directly or indirectly image the structure, function/pharmacology of the brain...
technologies such as fMRI
Functional magnetic resonance imaging
Functional magnetic resonance imaging or functional MRI is a type of specialized MRI scan used to measure the hemodynamic response related to neural activity in the brain or spinal cord of humans or other animals. It is one of the most recently developed forms of neuroimaging...
or PET
Positron emission tomography
Positron emission tomography is nuclear medicine imaging technique that produces a three-dimensional image or picture of functional processes in the body. The system detects pairs of gamma rays emitted indirectly by a positron-emitting radionuclide , which is introduced into the body on a...
. It may also refer to a specific piece of software created by the Wellcome Department of Imaging Neuroscience (part of University College London
University College London
University College London is a public research university located in London, United Kingdom and the oldest and largest constituent college of the federal University of London...
) to carry out such analyses.
Unit of measurement
Functional neuroimaging, one type of 'brain scanning', involves the measurement of brain activity. The specific technique used to measure brain activity depends on the imaging technology being used (see fMRI and PETPositron emission tomography
Positron emission tomography is nuclear medicine imaging technique that produces a three-dimensional image or picture of functional processes in the body. The system detects pairs of gamma rays emitted indirectly by a positron-emitting radionuclide , which is introduced into the body on a...
for examples). Regardless of which technology is used, the scanner produces a 'map' of the area being scanned that is represented as voxel
Voxel
A voxel is a volume element, representing a value on a regular grid in three dimensional space. This is analogous to a pixel, which represents 2D image data in a bitmap...
s. Each voxel typically represents the activity of a particular coordinate in three dimensional space. The exact size of a voxel will vary depending on the technology used, although fMRI voxels typically represent a volume of 27 mm3 (a cube with 3mm length sides).
Experimental design
Researchers are often interested in examining brain activity linked to a specific psychological process or processes. An experimental approach to this problem might involve asking the question 'which areas of the brain are significantly more active when a person is doing task A compared to task B?'. Although each task might be designed to be identical, except for the aspect of behaviour under investigation, the brain is still likely to show changes in activity between tasks due to factors other than task differences (as the brain is involved with co-ordinating a whole range of parallel functions unrelated to the experimental task). Furthermore, the signal may contain noise from the imaging process itself.To accommodate these random effects, and to highlight the areas of activity linked specifically to the process under investigation, statistics are used to look for the most significant difference above and beyond background brain activity. This involves a multi-stage process to prepare the data, and to subsequently analyse it using a statistical method known as the general linear model
General linear model
The general linear model is a statistical linear model.It may be written aswhere Y is a matrix with series of multivariate measurements, X is a matrix that might be a design matrix, B is a matrix containing parameters that are usually to be estimated and U is a matrix containing errors or...
.
Image pre-processing
Images from the brain scanner may be pre-processed before any statistical comparison takes place to remove noise or correct for sampling errors.A study will usually scan a subject several times. To account for the motion of the head between scans, the images will usually be adjusted so each of the voxels in the images corresponds (approximately) to the same site in the brain. This is referred to as realignment or motion correction, see image realignment.
Functional neuroimaging studies usually involve several participants, who will have slightly differently shaped brains. All are likely to have the same gross anatomy, but there will be minor differences in overall brain size, individual variation in topography of the gyri and sulci
Sulcus (neuroanatomy)
In neuroanatomy, a sulcus is a depression or fissure in the surface of the brain.It surrounds the gyri, creating the characteristic appearance of the brain in humans and other large mammals....
of the cerebral cortex
Cerebral cortex
The cerebral cortex is a sheet of neural tissue that is outermost to the cerebrum of the mammalian brain. It plays a key role in memory, attention, perceptual awareness, thought, language, and consciousness. It is constituted of up to six horizontal layers, each of which has a different...
, and morphological differences in deep structures such as the corpus callosum
Corpus callosum
The corpus callosum , also known as the colossal commissure, is a wide, flat bundle of neural fibers beneath the cortex in the eutherian brain at the longitudinal fissure. It connects the left and right cerebral hemispheres and facilitates interhemispheric communication...
. To aid comparisons, the 3D image of each brain is transformed so that superficial structures line up, a process known as spatial normalization
Spatial normalization
In neuroimaging, spatial normalization is an image processing step, more specifically an image registration method.Human brains differ in size and shape, and one goal of spatial normalization is to deform human brain scans so one location in one subject's brain scan corresponds to the same location...
. Such normalization typically involves not only translation and rotation, but also scaling and nonlinear warping of the brain surface to match a standard template. Standard brain maps such as the Talairach-Tournoux or templates from the Montréal Neurological Institute
Montreal Neurological Institute
The Montreal Neurological Institute and Hospital is an academic medical centre dedicated to neuroscience research, training and clinical care. The Institute is part of McGill University and the Hospital is one of the five teaching hospitals of the McGill University Health Centre, in Montreal,...
(MNI) are often used to allow researchers from across the world to compare their results.
Images are often smoothed (similar to the 'blur' effect used in some image-editing software) by which voxels are averaged with their neighbours, typically using a Gaussian
GAUSSIAN
Gaussian is a computational chemistry software program initially released in 1970 by John Pople and his research group at Carnegie-Mellon University as Gaussian 70. It has been continuously updated since then...
filter or by wavelet
Wavelet
A wavelet is a wave-like oscillation with an amplitude that starts out at zero, increases, and then decreases back to zero. It can typically be visualized as a "brief oscillation" like one might see recorded by a seismograph or heart monitor. Generally, wavelets are purposefully crafted to have...
transformation, to make the data less noisy.
Statistical comparison
Parametric statisticalParametric statistics
Parametric statistics is a branch of statistics that assumes that the data has come from a type of probability distribution and makes inferences about the parameters of the distribution. Most well-known elementary statistical methods are parametric....
models are assumed at each voxel, using the general linear model
General linear model
The general linear model is a statistical linear model.It may be written aswhere Y is a matrix with series of multivariate measurements, X is a matrix that might be a design matrix, B is a matrix containing parameters that are usually to be estimated and U is a matrix containing errors or...
to describe the variability in the data in terms of experimental and confounding effects, and residual variability. Hypotheses expressed in terms of the model parameters are assessed at each voxel with univariate statistics.
Analyses may also be conducted to examine differences over a time series
Time series
In statistics, signal processing, econometrics and mathematical finance, a time series is a sequence of data points, measured typically at successive times spaced at uniform time intervals. Examples of time series are the daily closing value of the Dow Jones index or the annual flow volume of the...
(i.e correlations between a task variable and brain activity in a certain area) using linear convolution
Convolution
In mathematics and, in particular, functional analysis, convolution is a mathematical operation on two functions f and g, producing a third function that is typically viewed as a modified version of one of the original functions. Convolution is similar to cross-correlation...
models of how the measured signal is caused by underlying changes in neural activity.
Because many statistical tests are being conducted, adjustments have to be made to control for Type I errors (false positives) potentially caused by the comparison of levels of activity at a large number of voxels. In this case, a Type I error would result in falsely detecting background brain activity as activity related to the task. Adjustments are made, based on the number of resel
Resel
A resel is a resolution element - a concept used in image analysis. It describes the actual spatial image resolution in an image .The number of resels in the image will be lower or equal to the number of pixel/voxels in the image....
s in the image and the theory of continuous random field
Random field
A random field is a generalization of a stochastic process such that the underlying parameter need no longer be a simple real or integer valued "time", but can instead take values that are multidimensional vectors, or points on some manifold....
s in order to set a new criterion for statistical significance that adjusts for the problem of multiple comparisons
Multiple comparisons
In statistics, the multiple comparisons or multiple testing problem occurs when one considers a set of statistical inferences simultaneously. Errors in inference, including confidence intervals that fail to include their corresponding population parameters or hypothesis tests that incorrectly...
.
Graphical representations
Differences in measured brain activity can be represented in a number of ways.Most simply, they can be presented as a table, displaying coordinates that show the most significant differences in activity between tasks. However, differences in brain activity are more often shown as patches of colour on an MRI brain 'slice', with the colours representing the location of voxels that have shown statistically significant differences between conditions. The gradient of color is mapped to statistical values, such as t-values or z-scores. This creates an intuitive and visually appealing means of delineating the relative statistical strength of a given area of activation. Recently, an alternative approach has been suggested, in which the statistical map is combined with the map of the original difference in brain activity (or, more generally speaking, with the original contrast) and colorcodes are attributed to the latter.
Differences in activity may also be represented as a 'glass brain', a representation of three outline views of the brain as if it were transparent. Only the patches of activation are visible as areas of shading. This is useful as a quick means of summarizing the total area of significant change in a given statistical comparison.
SPM software
SPM is software written by the Wellcome Department of Imaging Neuroscience at University College LondonUniversity College London
University College London is a public research university located in London, United Kingdom and the oldest and largest constituent college of the federal University of London...
to aid in the analysis of functional neuroimaging data. It is written using MATLAB
MATLAB
MATLAB is a numerical computing environment and fourth-generation programming language. Developed by MathWorks, MATLAB allows matrix manipulations, plotting of functions and data, implementation of algorithms, creation of user interfaces, and interfacing with programs written in other languages,...
and is distributed as free software
Free software
Free software, software libre or libre software is software that can be used, studied, and modified without restriction, and which can be copied and redistributed in modified or unmodified form either without restriction, or with restrictions that only ensure that further recipients can also do...
.
See also
- cognitive neuroscienceCognitive neuroscienceCognitive neuroscience is an academic field concerned with the scientific study of biological substrates underlying cognition, with a specific focus on the neural substrates of mental processes. It addresses the questions of how psychological/cognitive functions are produced by the brain...
- functional magnetic resonance imagingFunctional magnetic resonance imagingFunctional magnetic resonance imaging or functional MRI is a type of specialized MRI scan used to measure the hemodynamic response related to neural activity in the brain or spinal cord of humans or other animals. It is one of the most recently developed forms of neuroimaging...
- functional neuroimagingFunctional neuroimagingFunctional neuroimaging is the use of neuroimaging technology to measure an aspect of brain function, often with a view to understanding the relationship between activity in certain brain areas and specific mental functions...
- general linear modelGeneral linear modelThe general linear model is a statistical linear model.It may be written aswhere Y is a matrix with series of multivariate measurements, X is a matrix that might be a design matrix, B is a matrix containing parameters that are usually to be estimated and U is a matrix containing errors or...
- dynamic causal modellingDynamic causal modellingDynamic causal modelling is a method for the interpretation of functional neuroimaging data . It is implemented in the Statistical parametric mapping software. DCM is a recent technique, developed only in 2003....
- neuroimagingNeuroimagingNeuroimaging includes the use of various techniques to either directly or indirectly image the structure, function/pharmacology of the brain...
- AFNI
- FreeSurferFreeSurferFreeSurfer is an MRI brain imaging software package developed by the Athinoula A. Martinos Center for Biomedical Imaging at Massachusetts General Hospital. It is an important tool in functional brain mapping and facilitates the visualization of the functional regions of the highly-folded cerebral...
- FSLFMRIB Software LibraryThe FMRIB Software Library is a software library containing image analysis and statistical tools for functional, structural and diffusion MRI brain imaging data....
External links
- Wikibooks SPM Wikibook.
- fMRI guide by Chris Rorden
- Introduction to fMRI: experimental design and data analysis
- SPM software and documentation from the Wellcome Department of Imaging Neuroscience.
- Cambridge Imagers - Neuroimaging information and tutorials.
- Buttons in SPM5 PowerPoint presentation from the SPM for dummies course
- SPM-Information to include in papers
- ISAS (Ictal-Interictal SPECT Analysis by SPM) - Yale University
- AutoSPM: Automated SPM for Surgical Planning