
Segmented regression
Encyclopedia
Segmented regression is a method in regression analysis
in which the independent variable
is partitioned into intervals and a separate line segment is fit to each interval. Segmented or piecewise regression analysis can also be performed on multivariate data by partitioning the various independent variables. Segmented regression is useful when the independent variables, clustered into different groups, exhibit different relationships between the variables in these regions. The boundaries between the segments are breakpoints.
 Segmented linear regression is segmented regression whereby the relations in the intervals are obtained by linear regression
.
The breakpoint can be important in decision making
A segmented regression analysis is based on the presence of a set of ( y , x ) data, in which y is the dependent variable and x the independent variable
.
The least squares
method applied separately to each segment, by which the two regression lines are made to fit the data set as closely as possible while minimizing the sum of squares of the differences (SSD) between observed (y) and calculated (Yr) values of the dependent variable, results in the following two equations:
where:
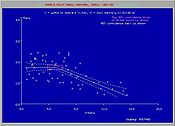
The data may show many types or trends, see the figures.
The method also yields two correlation coefficients
(R):
where:
In the determination of the most suitable trend, statistical tests must be performed to ensure that this trend is reliable (significant).
When no significant breakpoint can be detected, one must fall back on a regression without breakpoint.
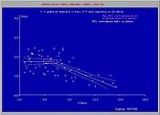
BP = 4.93 , A1 = 0 , K1 = 1.74 , A2 = −0.129 , K2 = 2.38 , (R1)2 = 0.0035 (insignificant) , (R2)2 = 0.395 (significant) and:
indicating that soil salinities < 4.93 dS/m are safe and soil salinities > 4.93 dS/m reduce the yield @ 0.129 t/ha per unit increase of soil salinity.
The figure also shows confidence intervals and uncertainty as eleborated hereunder.
In addition, use is made of the correlation coefficient
of all data (Ra) , the coefficient of determination
or coefficient of explanation , confidence interval
s of the regression functions , and Anova analysis.
The coefficient of determination for all data (Cd) , that is to be maximised under the conditions set by the significance tests, is found from:
where Yr is the expected (predicted) value of y according to the former regression equations and Ya is the average of all y values.
The Cd coefficient ranges between 0 (no explanation at all) to 1 (full explanation, perfect match).
In a pure, unsegmented, linear regression, the values of Cd and Ra2 are equal. In a segmented regression, Cd needs to be significantly larger than Ra2 to justify the segmentation.
The optimal
value of the breakpoint may be found such that the Cd coefficient is maximum
.
Regression analysis
In statistics, regression analysis includes many techniques for modeling and analyzing several variables, when the focus is on the relationship between a dependent variable and one or more independent variables...
in which the independent variable
Independent variable
The terms "dependent variable" and "independent variable" are used in similar but subtly different ways in mathematics and statistics as part of the standard terminology in those subjects...
is partitioned into intervals and a separate line segment is fit to each interval. Segmented or piecewise regression analysis can also be performed on multivariate data by partitioning the various independent variables. Segmented regression is useful when the independent variables, clustered into different groups, exhibit different relationships between the variables in these regions. The boundaries between the segments are breakpoints.
Linear regression
In statistics, linear regression is an approach to modeling the relationship between a scalar variable y and one or more explanatory variables denoted X. The case of one explanatory variable is called simple regression...
.
Segmented linear regression, two segments
Segmented linear regression with two segments separated by a breakpoint can be useful to quantify an abrupt change of the response function (Yr) of a varying influential factor (x). The breakpoint can be interpreted as a critical, safe , or threshold value beyond or below which (un)desired effects occur.The breakpoint can be important in decision making
A segmented regression analysis is based on the presence of a set of ( y , x ) data, in which y is the dependent variable and x the independent variable
Independent variable
The terms "dependent variable" and "independent variable" are used in similar but subtly different ways in mathematics and statistics as part of the standard terminology in those subjects...
.
The least squares
Least squares
The method of least squares is a standard approach to the approximate solution of overdetermined systems, i.e., sets of equations in which there are more equations than unknowns. "Least squares" means that the overall solution minimizes the sum of the squares of the errors made in solving every...
method applied separately to each segment, by which the two regression lines are made to fit the data set as closely as possible while minimizing the sum of squares of the differences (SSD) between observed (y) and calculated (Yr) values of the dependent variable, results in the following two equations:
- Yr = A1.x + K1 for x < BP (breakpoint)
- Yr = A2.x + K2 for x > BP (breakpoint)
where:
- Yr is the expected (predicted) value of y for a certain value of x;
- A1 and A2 are regression coefficients (indicating the slope of the line segments);
- K1 and K2 are regression constants (indicating the intercept at the y-axis).
The data may show many types or trends, see the figures.
The method also yields two correlation coefficients
Pearson product-moment correlation coefficient
In statistics, the Pearson product-moment correlation coefficient is a measure of the correlation between two variables X and Y, giving a value between +1 and −1 inclusive...
(R):
- (R1)2 = 1 − sum { (y − Yr)2 } / sum { (y − Ya1)2 } for x < BP (breakpoint)
- (R2)2 = 1 − sum { (y − Yr)2 } / sum { (y − Ya2)2 } for x > BP (breakpoint)
where:
- sum { (y − Yr)2 } is the minimimized SSD per segment;
- Ya1 and Ya2 are the average values of y in the respective segments.
In the determination of the most suitable trend, statistical tests must be performed to ensure that this trend is reliable (significant).
When no significant breakpoint can be detected, one must fall back on a regression without breakpoint.
Example
For the blue figure at the top of the page that gives the relation between yield of mustard (Yr = Ym , t/ha) and soil salinity (x = Ss , expressed as electric conductivity of the soil solution EC in dS/m) it is found that:BP = 4.93 , A1 = 0 , K1 = 1.74 , A2 = −0.129 , K2 = 2.38 , (R1)2 = 0.0035 (insignificant) , (R2)2 = 0.395 (significant) and:
- Ym = 1.74 t/ha for Ss < 4.93 (breakpoint)
- Ym = −0.129 Ss + 2.38 t/ha for Ss > 4.93 (breakpoint)
indicating that soil salinities < 4.93 dS/m are safe and soil salinities > 4.93 dS/m reduce the yield @ 0.129 t/ha per unit increase of soil salinity.
The figure also shows confidence intervals and uncertainty as eleborated hereunder.
Test procedures
The following statistical tests are used to determine the type of trend:- significance of the breakpoint (BP) by expressing BP as a function of regression coefficients A1 and A2 and the means Y1 and Y2 of the (y) data and the means X1 and X2 of the x data (left and an right of BP), using the laws of propagation of errorsPropagation of uncertaintyIn statistics, propagation of error is the effect of variables' uncertainties on the uncertainty of a function based on them...
in additions and multiplications to compute the standard errorStandard errorStandard error can refer to:* Standard error , the estimated standard deviation or error of a series of measurements* Standard error stream, one of the standard streams in Unix-like operating systems...
(SE) of BP, and applying Student's t-testStudent's t-testA t-test is any statistical hypothesis test in which the test statistic follows a Student's t distribution if the null hypothesis is supported. It is most commonly applied when the test statistic would follow a normal distribution if the value of a scaling term in the test statistic were known... - significance of A1 and A2 applying Student's t-distribution and the standard error SE of A1 and A2
- significance of the difference of A1 and A2 applying Student's t-distribution using the SE of the difference.
- significance of the difference of Y1 and Y2 applying Student's t-distribution using the SE of the difference.
In addition, use is made of the correlation coefficient
Pearson product-moment correlation coefficient
In statistics, the Pearson product-moment correlation coefficient is a measure of the correlation between two variables X and Y, giving a value between +1 and −1 inclusive...
of all data (Ra) , the coefficient of determination
Coefficient of determination
In statistics, the coefficient of determination R2 is used in the context of statistical models whose main purpose is the prediction of future outcomes on the basis of other related information. It is the proportion of variability in a data set that is accounted for by the statistical model...
or coefficient of explanation , confidence interval
Confidence interval
In statistics, a confidence interval is a particular kind of interval estimate of a population parameter and is used to indicate the reliability of an estimate. It is an observed interval , in principle different from sample to sample, that frequently includes the parameter of interest, if the...
s of the regression functions , and Anova analysis.
The coefficient of determination for all data (Cd) , that is to be maximised under the conditions set by the significance tests, is found from:
- Cd = 1 − sum { (y − Yr)2 } / sum { (y − Ya)2 }
where Yr is the expected (predicted) value of y according to the former regression equations and Ya is the average of all y values.
The Cd coefficient ranges between 0 (no explanation at all) to 1 (full explanation, perfect match).
In a pure, unsegmented, linear regression, the values of Cd and Ra2 are equal. In a segmented regression, Cd needs to be significantly larger than Ra2 to justify the segmentation.
The optimal
Optimization (mathematics)
In mathematics, computational science, or management science, mathematical optimization refers to the selection of a best element from some set of available alternatives....
value of the breakpoint may be found such that the Cd coefficient is maximum
Maxima and minima
In mathematics, the maximum and minimum of a function, known collectively as extrema , are the largest and smallest value that the function takes at a point either within a given neighborhood or on the function domain in its entirety .More generally, the...
.
External links, software
- SegReg, download free software for segmented linear regression at : http://www.waterlog.info/segreg.htm