

Sediment Profile Imagery
Encyclopedia
Sediment Profile Imagery (SPI) is an underwater technique for photographing the interface between the seabed
and the overlying water. The technique is used to measure or estimate biological, chemical, and physical processes occurring in the first few centimetres of sediment
, pore water
, and the important benthic boundary layer of water. Time-lapse
imaging (tSPI) is used to examine biological activity over natural cycles, like tides and daylight or anthropogenic
variables like feeding loads in aquaculture
. SPI systems cost between tens and hundreds of thousands of dollars and weigh between 20 and 400 kilograms. Traditional SPI units can be effectively used to explore continental shelf
and abyssal depths. Recently developed SPI-Scan or rSPI (rotational SPI) systems can now also be used to inexpensively investigate shallow (<50m) freshwater, estuarine
, and marine
systems.
in order to investigate animal-sediment interactions in the marine benthos. Rhoads and Cande (1971) took pictures of the sediment-water interface at high resolution (sub-millimetre) over small spatial scales (centimetres) in order to examine benthic patterns through time or over large spatial scales (kilometres) rapidly. Slicing into seabeds and taking pictures instead of physical cores, they analysed images of the vertical sediment profile in a technique that came to be known as SPI. This technique advanced in subsequent decades through a number of mechanical improvements and digital imaging and analysis technology. SPI is now a well-established approach accepted as standard practice in several parts of the world, though its wider adoption has been hampered partly because of equipment cost, deployment, and interpretation difficulties. It has also suffered some paradigm setbacks. The amount of information that a person can extract from imagery, in general, is not easily and repeatedly reduced to quantifiable and interpretable values (but see Pech et al. 2004; Tkachenko 2005). Sulston and Ferry (2002) wrote about this difficulty in relation to the study of the human genome. Electron microscope images of their model organism (Caenorhabditis elegans) carried a lot of information but were ignored by many scientists because they were not readily quantified, yet that pictorial information ultimately resulted in a deep, and quantifiable, understanding of underlying principles and mechanisms. In the same way, SPI has been used successfully by focusing on the integration of visual data and a few objectively quantifiable parameters in site reconnaissance and monitoring.
Figure 1. Schematic drawing of the profile camera in partial cross section showing the cradle in the down position intersecting the bottom. A- slack winch-wire; B- oil-filled cylinder; C- piston rod; D- piston containing a small diameter hole; E- battery housing with magnetic reed switch, F- lead weights, G- camera (oriented vertically); H- light; I- Plexiglas guillotine filled with distilled water; J- sediment-water interface; K- 45° angle mirror reflecting the sediment-water interface profile 90° to the camera lens. Taken from Rhoads and Cande (1971).
Their device returned images such as that shown in Figure 2. At first glance SP images may appear unremarkable, but analysis of dozens of images allows the breadth of information they contain to become apparent. In Figure 2 the gross texture and water content of the sediment is immediately apparent. Since resolution allows imaging of individual sand grains, the classic textural parameters (percentage of gravel, sand, and mud) can be assessed and a mean grain size estimated. The sediment-water interface is clear. If the image was taken immediately upon insertion, this observation indicates that the device entered the seabed with little disturbance. Furthermore, the interface is distinct. While seemingly straightforward, some seabeds have, instead, a boundary layer of suspended sediments with a broad density gradient instead of a discrete transition point. This condition has a fundamental importance to many benthic organisms. Biological activity is readily apparent as well. When calibrated using traditional grab samples or cores coupled with a few SP images, resolution allows identification of some infauna including the tubicolous sabellid polychaetes, a bisected nereid, and the mound produced by a sea cucumber seen in Figure 2.
Figure 2. Sediment profile photograph of a mud bottom 35 m deep in Cape Cod Bay, Massachusetts. The place of the photograph passes through a fecal mound produced by Molpadia oolitica (holothurian). The apex of the cone is populated by the sabellid polychaete Euchone incolor (A). An errant polychaete has been cut by the guillotine (B). Void spaces at depth are produced by the feeding activities of M. oolitica (C). Light-coloured oxidized (sulfide-poor) sediment extends about 3 cm below the sediment surface. Taken from Rhoads and Cande (1971).
Another significant feature of Figure 2 is the distinct colour change between surface sediments and those deeper. This gradient of colour change, though continuous, is known as the apparent redox potential discontinuity depth (ARPD) when reduced to an average transition point. When properly considered in conjunction with local geology and bioturbation levels, the depth and character of the ARPD can provide profound insights into the interactions between sediment geochemistry and biologic activity. Graf’s review (1992) supports the early observations of Jorgensen & Fenchel (1970) that sediments can be divided into oxic, suboxic, and anoxic levels with fundamental consequences for biota. They defined these boundaries as occurring at the >300 mV (oxidation reduction potential) level for oxic and less than 100 mV for anoxic chemoclines (with suboxic in between) as presented in Figure 3. The vertical position of these boundaries can vary seasonally and locally in response to detrital supply and mixing (due to bioturbation or physically mediated mixing) as fast as 1 cm d-1. Anoxic sediments tend to be toxic to most animals because of free H2S and low pH. In this reducing environment, heavy metals can also precipitate. Some heavy metals, like cadmium and copper, are stabilised as sulphides and do not readily dissolve, but can be remobilised quickly and pollute boundary layer water if oxic conditions are restored (Graf 1992). The sediment penetration of chemical species from overlying waters to these layers will depend heavily upon the size and shape of sediment grains. Using a fluid bromide tracer, Dicke (in Graf 1992) found molecular diffusion alone to penetrate soft sediments to 4 cm in one day and 8 cm after 4 days. Bioturbation can accelerate this process by up to a factor of ten. Thus, the chemoclines affect and are, in turn, affected by benthic organisms. Besides exclusion and bioturbation effects of aerobic organisms, Fenchel and Riedl (1970) pioneered investigations into an unusual fauna inhabiting the suboxic regions of sediment. Clearly, SPI tools have much to offer in investigations of this sort.

Figure 3. The redox potential discontinuity (RPD) - layer concept of Fenchel & Reidel (1970). The sediment is divided into anoxic, suboxic, and oxic layers. Along the walls of tubes and burrows of animals the redox isolines are depressed (cf. Jorgensen & Revsbech, 1985). According to micro-electrode measurements of oxygen, the so-called oxic layer does not really contain free oxygen over the entire depth. Figure taken from Graf (1992).
Rhoads and Germano (1982) developed a list of parameters taken from SPI in an effort to reduce and quantify specific environmental attributes and make them amenable to traditional statistical analysis. Their list has been modified and qualified throughout the literature, but is summarised in Table 1. A few of these parameters can be calibrated and are reproducible in a variety of habitats. Gross sediment texture is probably the least controvertible and most immediately informative parameter for producing benthic habitat maps and identifying sediment-modifying impacts. The apparent redox potential discontinuity (ARPD) can also be a powerful assessment parameter. For example, one of the reported effects of sustained aquaculture activity on coastal environments is the deposition and accumulation of organic-rich sediments near the production site whether from the faeces and pseudofaeces of shellfish or uneaten food and excretion of fin fish. This can result in an increase in oxygen consumption by the sediment, formation of anoxic sediments, and the production and release of harmful gases such as methane, H2S, and CO2 which can affect the water column, benthic macrofauna (Pocklington et al. 1994), and meiofauna (Mazzola et al. 1999).
The relationships between infauna, suboxic sediments, and organic enrichment are well documented (Weston 1990; Rees et al. 1992; Hargrave et al. 1997). This system is much like that described by Pearson and Rosenberg (1978) as presented in Figure 4. Rhoads and Germano (1982) took this concept one step further by assigning categories to the various successional stages in an attempt to integrate the biotic and geochemical responses to organic enrichment. To be used reliably, successional stage determinations must be made within the biological and physical context of each study, are necessarily subjective, and are unlikely to be more than broadly informative between analysts. Similarly, the majority of parameters presented in Table 1 are site- and study-specific. Acting in a similar manner to a cone penetrometer, the SPI wedge penetration depth into soft sediments may be generally useful as a proxy for sediment fabric if calibrated, but results will be sensitive to differences in equipment and deployment.
Table 1
Figure 4. Diagram of changes in fauna and sediment structure along a gradient of organic enrichment (Pearson and Rosenberg 1978).
Even with these limitations SPI can be an extremely powerful analytical, reconnaissance, and monitoring tool. Sediment-type maps have often been constructed by retrieving grab or core samples followed by days or weeks of laboratory-based processing. After an SPI device is lowered into the sediment and the image recorded, it can be hauled up and lowered repetitively without fully recovering the device. Such a vessel ‘stitching’ an SPI device along a prescribed route can survey an area with unprecedented economy compared to physical sample recovery. There is, of course, a trade-off between sampling data quality and quantity. SPI allows much greater spatial coverage for a given amount of field time at the cost of the detailed sediment descriptors typically produced from physical cores (half phi interval texture analysis, carbon content, etc.). Managing this balance is the essence of good SPI use and highlights its strengths. For example, Hewitt et al. (2002), Thrush et al. (1999), and Zajac (1999) call attention to the value of integrating macrofaunal community observations collected at different scales and their application in describing processes occurring at different scales within a heterogeneous benthic landscape. When evaluating landscape-scale questions it is rarely feasible to simply and comprehensively sample the total spatial extent with dense, equivalently detailed sampling points. The researcher must compromise between data collection grain, dimensions of the actual sampling unit (typically 0.1 m2 grab or similar), and lag- distance between sample units over which results will be interpolated (often tens to hundreds of metres for grab samples). Sediment profile imagery can be an efficient monitoring tool when coupled with more detailed sampling techniques such as macrofaunal core sampling, or continuous sediment survey transects (Gowing et al. 1997). It offers point data that can be economically collected at sufficient frequency to connect more resource-intensive samples in an ecologically meaningful way. A study can therefore operate at nested spatio-temporal scales with SPI providing overall maps and connectivity while other sampling techniques are used to characterise assemblages and variability within habitat types. This type of integration is necessary for developing our understanding and predictability of soft-sediment processes (Thrush et al. 1999; Noda 2004).
SPI can be applied to other, perhaps more common, benthic disturbance investigations as well. To illustrate, consider a benthic ecological impact study for a hypothetical shellfish mariculture facility. There are an enormous variety of study approaches. Existing information and the available resources inevitably constrain every design. With little information on bottom type, a simple, one-off, spatial impact study like that shown in Figure 5 with eight sites along an isobath, taking three replicate grabs from each, is fairly common and moderately powerful. Prior data gathering including bathymetric, diver, towed-camera, ROV, or side-scan sonar observations would probably alter site placement and greatly enhance overall information and value. Collecting such data over even a small site such as this one requires considerable resources and will probably cause a gap of several days to allow data processing between the first field days and the grab sampling events (It is this delay that precludes, or reduces, the value of studying transient events in hydrodynamically energetic areas). Collecting a large number of point data from an SPI device is easily done where the resulting snapshots of the benthic character are automatically placed on a map of the study area in real time. This approach allows rapid categorisation according to one or more variables of interest. In waters <30 m deep it is not unreasonable to expect to collect the 170 SP images indicated in Figure 6 and produce a rough benthic classification map in a single field day. The categories may be based on sediment texture, overburden, specific detritus, biota, etc. Sampling effort can then be allocated to focus on the variability of communities among the gross habitat differences by using grabs as habitat replicates with varying lag. This type of approach produces a broader understanding of the system and permits more informed decisions by increasing the generality of the grab sample data. The SPI evidence can effectively increase the extent from one dimension to at least two. Correlation between physical and biological data collected from the grabs also allows more data to be extracted from the SP imagery by identifying specific features (infaunal species, tubes, mounds, etc.). Furthermore, a detailed analysis of ARPD depths can then be presented as geochemical environment contours.
Figure 5. An example of a typical mussel farm sampling protocol (x = grab collection) without a habitat-type map.

Figure 6. An example of relocating the same grab sample effort (as in figure FARM1) in response to habitat-type data collected by an SPI device in order to evaluate interpolation assumptions and increase the extent of the findings.
Rhoads and Germano (1982) compare SPI techniques with three other studies off the east coast of the USA. Their work put SPI within an accepted ecological framework and subsequently widened its appeal and value as a standard monitoring tool. Solan et al. (2003) review the broader conceptual shift from traditional “kill ‘em and count ‘em” methodologies in benthic studies and show how integrating SPI and other optical and acoustic technologies with traditional sampling has fundamentally added to our understanding of several benthic processes. Although most SPI studies remain in the ‘grey literature’ (Keegan et al. 2001), a growing number and variety of applications is appearing. SPI-produced data were as informative as macrofaunal samples along an organic enrichment gradient in a temperate system (Grizzle and Penniman 1991). Other studies include those by Germano (1992) who investigated dredge-spoil disposal in Auckland’s Hauraki Gulf, and Heip (1992) who summarised the value of SPI alongside meio- and macrofaunal sampling near an ocean drilling platform off the German Bight. Rumohr and Schomann (1992) found that the SP imagery provided important clues and context for interpretation of otherwise enigmatic benthic data. Early work using SPI to identify hydrocarbon contamination (Diaz et al. 1993) was later refined to include more accurate and precise measurements by spectroscopy (Rhoads et al. 1997). Smith et al. (2003) investigated fishing trawl impacts using SPI, whilst Solan and Kennedy (2002) demonstrated the use of time-lapse SPI for quantifying ophiuroid bioturbation. Diaz and Cutter (2001) used the same method for quantifying polychaete bioturbation through transient burrow formation and its relationship with oxygen penetration into sediments. NOAA (2003 and references therein) report the widespread use of SPI for habitat mapping, dredge material cap monitoring, and oxygen stress (Nilsson and Rosenberg 1997) in estuarine, coastal, and deep water environments. Beyond pure research, SPI is a technique well suited to tiered monitoring and compliance. It is now widely accepted as a standard technique (Rhoads et al. 2001). Clearly, the applications of SPI are diverse and scientifically robust when properly applied, but some practical problems limit its wider use. Keegan et al. (2001) summarise that SPI is “...not developed as a replacement for conventional benthic monitoring tools, but as a survey and reconnaissance technique to optimise the efficiency of benthic monitoring programs.” They further state:
Development of the SPI-Scan system http://www.benthicscience.com/bshome.htm, also known as rSPI (rotational SPI) by Brian Paavo and Benthic Science Limited addresses the problems of mass and expense to enable lake and coastal users to economically deploy SPI systems from small vessels.
Keegan et al. (2001) described the relationships among workers and authorities evaluating long-established, though often expensive and slow, methodologies with more recent technological developments as sometimes discordant. Gray et al. (1999b) lamented that there is a strong institutional tendency for sediment ecologists to rely on sampling methods developed in the early 1900s! A fine balance needs to be struck. Some degree of paradigm inertia is necessary to maintain intellectual continuity, but it can be taken too far. Physics, as a science, confronted this issue long ago and has widely embraced new technologies after establishing a scientific culture of always linking new techniques to established findings in a period of calibration and evaluation. The pace of this process in biology, as a whole, has quickened over the past few decades and ecology has only recently come to this horizon. This article introduces one such technology, sediment profile imagery (SPI) that is slowly gaining acceptance and currently undergoing its evaluation and calibration period even though it has existed since the 1970s. Like many of the technologies mentioned above, each new capability requires a careful consideration of its appropriateness in any particular application. This is especially true when they cross important, though often subtle, boundaries of data collection limitations. For example, much of our benthic knowledge has been developed from point-sample methods like cores or grabs, whereas continuous data collection, like some video transect analysis methods (e.g. Tkachenko 2005), may require different spatial interpretations that more explicitly integrate patchiness. While remote sampling techniques often improve our point-sampling resolution, benthologists need to consider the real-world heterogeneity at small spatial scales and compare them to the noise inherent to most high-volume data collection methods (e.g. Rabouille et al. 2003 for microelectrode investigations of pore water). New developments in the field of SPI will provide tools for investigating dynamic sediment processes, but also challenge our ability to accurately interpolate point-data collected at spatial densities approaching continuous data sets.
SP imagery as embodied in the commercial REMOTS system (Rhoads et al. 1997) is expensive (>NZ$60,000 at time of writing), requires heavy lifting gear (ca. 66-400 kg with a full complement of weights to effectively penetrate sediments), and is limited to muddy sediments. REMOTS is not well suited to small research programmes, nor operation in shallow water from small vessels, which is, quite possibly, an area where it could be most useful. Studying shallow sub-tidal environments can be a challenging exercise, especially among shifting sands. Macrofaunal sampling usually occurs at the sub-metre scale, whilst the dominant physical factors such as wave exposure and sediment texture can change at a scale of only metres, even though they are often only resolved to a scale of hundreds of metres. In such a dynamic environment, monitoring potentially transient disturbances like a spoil mound requires benthic mapping at fine spatial and temporal scales, an application ideally suited to SPI.
W = Fd
where W = work, F = force, and d=distance. Displacing any sediment grain requires a certain amount of work to overcome both inertia and the friction generated by all adjacent grains (both static and dynamic). The wedge does displacement work by using less force at the cost of increasing the distance the grain must travel. In order to reduce the size of an SPI device it makes sense to reduce the amount of work required to displace sediment for a given imaging area. Being in an aquatic environment gives the first advantage to reducing work. By increasing the water content of sediments, both static and dynamic coefficients of friction from grain-on-grain interactions are greatly reduced. At these large physical scales, viscosity interactions are very small compared to friction. Therefore, fluidising sediments would allow an SPI device to displace more and coarser sediments with less downward force. (Of course all mass-energy is conserved – more work is required to pump the water into sediments – but at least that can be done away from the wedge.) It is important to cleanly separate sediments to be fluidised and removed from the sedimentary fabric that must be imaged intact.
Water lubrication can be used to reduce the amount of force required and lessen required workload, but can we also reduce the distance grains need to be displaced? The imaging mirror is the greatest constraint to reducing grain displacement so it makes sense to dispense with it. A number of commercial and consumer line scanners exist which digitise an image by moving in a plane recording the colour and intensity of light encountered. Flatbed scanners and digital photocopiers are examples of this technique. Light shining from the device reflects off the scene to be imaged to a sensor located near the light source. The light’s path can be folded and manipulated by a series of intermediary mirrors and lenses to a small linear sensor array or directly to a large array of tiny sensors. Pushing a thin flatbed scanner into sediments requires much less work than pushing a large prism, as concluded by Keegan et al. (2001):
The engineering problems of resolution, weight, and pressure and shock-resistance are compounded by keeping the scanner in a rectangular configuration (Patterson et al. 2006). Most underwater equipment is housed in cylinders because cylinders present a smaller surface area for enclosing a given volume than a rectangular enclosure. For a given surface (imaging) area, fewer sediment grains will need to be displaced a shorter distance when imaged from the perimeter of a cylinder than the oblique face of a wedge. It is a conceptually simple matter to modify a consumer flatbed scanner so that its scan head (containing light source and sensor array) moves in a circular path instead of a plane as illustrated in Figure 7. This configuration change allows for a more efficient wedge geometry or, as we’ll see later, permits its elimination.
Figure 7. Changing the scan head path from the typical plane found in consumer scanners to a circular path allows imaging of the same area with a much smaller perpendicular plan area (which is the face that must penetrate sediments). This configuration also allows use of the mechanically superior (under external pressure) cylinder rather than a box.
A suitable scan head model that could be reconfigured to fit within an 80 mm diameter cylinder was located, and the scanner’s standard stepper motor was modified to fit within the same space. The entire unit was then mounted on a stainless steel pivot and rotated by a spring-loaded friction wheel pressing against the inner wall of the cylinder. Since the perimeter of the cylinder (250 mm) was smaller than the typical scan path (300 mm) the motor gearing was reduced to improve along-path scan resolution, the resulting change in image geometry was relatively easy to correct in the image capture software. The resulting assembly is shown in Figure 8.

Figure 8. This is the scanning module of the first SPI-Scan sediment profile imager. A) stepper-motor, gearing, and friction wheel assembly, B) scan head with modified electronics mounted on the non-imaging surfaces. NOTE: This photo was taken using a wide-angle lens, producing distortion.
The tight fit of the electronics required fairly close internal tolerances and the transparent cylinder needed to fit within an external armour cylinder with closer tolerances. The latter was necessary to avoid gaps between the sediment face to be imaged and the imaging plane. Gaps allow sediments to fall or smear and degrade the scientific value of the sediment profile. Stainless steel automobile exhaust tubing swaged by a hydraulic ram using a custom turned stainless steel (316) cone was ultimately used. Portals were cut into the centre section to allow imaging of a 210 x 150 mm area divided among four windows.
In order to inject water into sediments so as to displace some but not disturb others a penetrating head was cast and plumbed. A number of penetrating head geometries were explored using a series of ¼ scale models attached to a penetrometer and forced into sandy sediments under water. A sharply angled plane with an offset conic section removed was chosen as the most efficient. With this configuration, the head first separated (by force) the sediments to be displaced while supporting the sediments of the bore wall. A vortex of water was created by angled water jets in the conic space. This design massively disturbed sediments in one ‘exhaust’ sector of the SPI image, but minimised disturbance in the remainder. The penetrator head was made by first carving 1.5 kg of butter into the desired shape, then casting a negative in plaster-of-Paris, water jets (copper tubing) were mounted within the mold, the assembly was dried in an oven at 70°C for three days, and then positively cast using about 7 kg of molten lead. The final penetrator head is shown in Figure 10. Prior to deployment the device required a tether providing electrical and mechanical connections to the surface vessel and a frame to ensure that it entered the seabed perpendicularly.

Figure 10. A) displacement-aspect of penetrator head showing water jet placement, B) side-view, C) diagram of jet-induced water flow pattern to fluidise sediments and encourage them to move up and out of the bore hole, D) Top view (perpendicular to viewing plane) showing area of disturbed (1) and undisturbed sediments, E) final casting for prototype.
The first prototype was constructed as a proof-of-concept exercise. The glass cylinder was unlikely to survive repeated use in the field. The device was subjected to a simulated SPI application: spoil mound cap monitoring. A 450 l drum was filled with fine sand from a local beach. Glutinous silt and clay-sized material was then laid down in discrete layers with the sand. A coarse-sand ‘cap’ was then laid on top and the whole drum filled with seawater. Penetration was satisfactory (13 cm of image, another 15 cm for the penetrator head), but resolution was poor as expected.
These decisions led to an alternate scanner technology that had been developed and marketed mostly in the early 2000s. It is known by various names such as contact imaging, direct imaging, or LED indirect exposure (US Patent 5499112). In this technology, a string of LEDs strobe the primary colours onto an imaging plane. Illumination is crucial so the imaging plane must be close. Reflected light from the imaging plane is directed into an array of light guides which lead to CCD elements. The physical arrangement between the light guides and the imaging plane is what limits the depth of field using this technology. Tests using consumer scanners indicated that the imaging plane could be 1-3 mm away from the scan head for full resolution images, but dropped off quickly beyond that. Scene features 5 mm or more away from the scan head were almost unidentifiable. Since the primary value of SP imagery is two-dimensional, this limitation was a small trade off for the great savings in space. The solid-state technology is robust to vibration and no mirrors are necessary. Unfortunately, UV illumination was difficult to provide without a custom-designed scan head and was therefore not included in the second prototype.
One major advantage of SPI is that it reliably provides sediment information regardless of water clarity. However, many SPI applications such as habitat mapping and side-scan sonar ground-truthing, would benefit from imagery of the seabed’s surface when visibility permits. Since the tether provided a source of power and computer connectivity with the surface vessel, adding a digital camera to image the seabed surface immediately adjacent to the sediment profile was another conceptually simple addition. A laser array surrounding the camera provided a means to correct the geometry of the seabed surface image (since it is captured at a variable angle) and its scale. Such imagery provides a larger reference frame in which to interpret the adjacent sediment profile and permits a more informed estimation of the habitat connectivity of multiple profiles. A longitudinal section of the second prototype with the seabed surface camera is presented in Figure 11. The typical deployment configuration is shown in Figure 12.

Figure 11. A longitudinal section through the second prototype SPI-Scan imager produced by Benthic Science Limited. A) electronics space, B) motor/gearing assembly connected to vertical drive shaft, C) one of five lasers, D) seabed surface CCD, E) camera pod, F) scan head, G) field-changeable penetrator with water galleries and jets, H) field-changeable cutting blade, I) scan head holder, J) central pressurised water gallery, K) transparent polycarbonate cylinder, L) water pump.

Figure 12. Diagram of second prototype (one leg of frame removed for clarity) as envisioned in situ with scale/geometry lasers active emanating from surface camera pod.
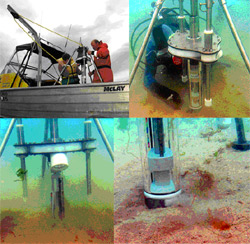
Figure 13. The second prototype in field trials. Seen here deploying from the 6 m R/V Nauplius (upper left), on the seabed though locked in the up position (upper right and lower left – lasers not visible here), and starting to dig into the sand (lower right).
The next set of sea trials were conducted near an aquaculture facility from a 5 m research vessel. Seventy-eight images from about 20 deployments were collected. Figure 14 presents two representative images. The digital images carry much more detail than reproduced here as Figure 15 demonstrates.

Figure 14. Here are two portions of sediment profiles taken 1 km from an aquaculture facility along the tidal current (left) and across (right). The right hand scale divisions are 1 mm apart.
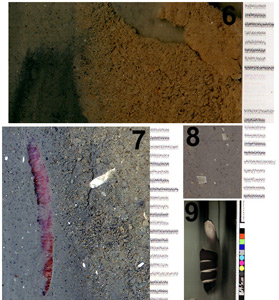
Figure 15. Portions of images in figure 14 are shown in panels 6, 7, and 8. Sediment texture is detailed in panel 6, a polychaete worm is evident in panel 7, and panel 8 shows Echinocardium (heart urchin) shell fragments in silt matrix. Panel 9 shows a diver giving the ‘thumbs up’ sign to the scanner to illustrate the limited depth of field of the second prototype. Poor water visibility is also in evidence by the heavy background lighting. All scale divisions are in millimetres.
The surface computer stamped the date and time of collection directly onto the SP image. Custom software integrated an NMEA data stream from a GPS connected to the computer’s serial port to also stamp the geographic position of the surface vessel (or of the device if corrected by NMEA output from an acoustic positioning beacon array). The software further uses a modification of the GEOTiff graphic standard to embed geographic position and datum information into the image tags. This permits automatic placement of SPI and seabed surface images into spatially appropriate positions when opening within a GIS package. This functionality allows real time assessment of benthic data in the field to inform further sampling decisions.
Keegan et al. (2001) pointed out that chemical and physical environmental measurements alone are easily quantified and readily reproducible, but are overall poor monitors of environmental health. Biological and ecological theory is well enough advanced to be a full partner in environmental legislation, monitoring, and enforcement (Karr 1991) and can provide the appropriate local context for interpretation of physico-chemical results. In a typical assessment of mariculture impacts on the benthos Weston (1990) found that sediment chemistry (CHN, water-soluble sulfides, and redox measures) measures of organic enrichment effects extended only 45 m from the farm, but benthic community effects were apparent to 150 m. SPI can elucidate many of these important biological parameters. Benthic Science Limited continues development of SPI-Scan technology.
Seabed
The seabed is the bottom of the ocean.- Ocean structure :Most of the oceans have a common structure, created by common physical phenomena, mainly from tectonic movement, and sediment from various sources...
and the overlying water. The technique is used to measure or estimate biological, chemical, and physical processes occurring in the first few centimetres of sediment
Sediment
Sediment is naturally occurring material that is broken down by processes of weathering and erosion, and is subsequently transported by the action of fluids such as wind, water, or ice, and/or by the force of gravity acting on the particle itself....
, pore water
Groundwater
Groundwater is water located beneath the ground surface in soil pore spaces and in the fractures of rock formations. A unit of rock or an unconsolidated deposit is called an aquifer when it can yield a usable quantity of water. The depth at which soil pore spaces or fractures and voids in rock...
, and the important benthic boundary layer of water. Time-lapse
Time-lapse
Time-lapse photography is a cinematography technique whereby the frequency at which film frames are captured is much lower than that which will be used to play the sequence back. When replayed at normal speed, time appears to be moving faster and thus lapsing...
imaging (tSPI) is used to examine biological activity over natural cycles, like tides and daylight or anthropogenic
Anthropogenic
Human impact on the environment or anthropogenic impact on the environment includes impacts on biophysical environments, biodiversity and other resources. The term anthropogenic designates an effect or object resulting from human activity. The term was first used in the technical sense by Russian...
variables like feeding loads in aquaculture
Aquaculture
Aquaculture, also known as aquafarming, is the farming of aquatic organisms such as fish, crustaceans, molluscs and aquatic plants. Aquaculture involves cultivating freshwater and saltwater populations under controlled conditions, and can be contrasted with commercial fishing, which is the...
. SPI systems cost between tens and hundreds of thousands of dollars and weigh between 20 and 400 kilograms. Traditional SPI units can be effectively used to explore continental shelf
Continental shelf
The continental shelf is the extended perimeter of each continent and associated coastal plain. Much of the shelf was exposed during glacial periods, but is now submerged under relatively shallow seas and gulfs, and was similarly submerged during other interglacial periods. The continental margin,...
and abyssal depths. Recently developed SPI-Scan or rSPI (rotational SPI) systems can now also be used to inexpensively investigate shallow (<50m) freshwater, estuarine
Estuary
An estuary is a partly enclosed coastal body of water with one or more rivers or streams flowing into it, and with a free connection to the open sea....
, and marine
Marine (ocean)
Marine is an umbrella term. As an adjective it is usually applicable to things relating to the sea or ocean, such as marine biology, marine ecology and marine geology...
systems.
Advantages
Humans are strongly visually oriented. We like information in the form of pictures and are able to integrate many different kinds of data when they are presented in one or more images. It seems natural to seek a way of directly imaging the sediment-water interfaceSediment-water interface
In oceanography and limnology, the sediment-water interface is the boundary between bed sediment and the overlying water column. The topography of this interface is often dynamic, as it is affected by physical processes and biological processes ....
in order to investigate animal-sediment interactions in the marine benthos. Rhoads and Cande (1971) took pictures of the sediment-water interface at high resolution (sub-millimetre) over small spatial scales (centimetres) in order to examine benthic patterns through time or over large spatial scales (kilometres) rapidly. Slicing into seabeds and taking pictures instead of physical cores, they analysed images of the vertical sediment profile in a technique that came to be known as SPI. This technique advanced in subsequent decades through a number of mechanical improvements and digital imaging and analysis technology. SPI is now a well-established approach accepted as standard practice in several parts of the world, though its wider adoption has been hampered partly because of equipment cost, deployment, and interpretation difficulties. It has also suffered some paradigm setbacks. The amount of information that a person can extract from imagery, in general, is not easily and repeatedly reduced to quantifiable and interpretable values (but see Pech et al. 2004; Tkachenko 2005). Sulston and Ferry (2002) wrote about this difficulty in relation to the study of the human genome. Electron microscope images of their model organism (Caenorhabditis elegans) carried a lot of information but were ignored by many scientists because they were not readily quantified, yet that pictorial information ultimately resulted in a deep, and quantifiable, understanding of underlying principles and mechanisms. In the same way, SPI has been used successfully by focusing on the integration of visual data and a few objectively quantifiable parameters in site reconnaissance and monitoring.
History and application
Conventional diving is limited to shallow waters. Remotely sampling deeper sediments of high water content is often unreliable due to sampler bow waves, compaction upon impact, or variably disrupted surface sediment features (Somerfield and Clarke 1997). In 1971, Rhoads and Cande described an instrument to address the problems of adequately observing and collecting silty sediments. Their remote sampling equipment introduced the field of in situ vertical sediment profile imagery and what are now commonly called SPI cameras. The device mainly consists of a wedge-shaped box mounted in a frame. The box has an oblique face made of transparent acrylic and a downward-looking camera (Figure 1). Weights force the wedge and its internal mirror into the sediments. The mirror, at 45° to the transparent section, reflects an image of the pierced sediment-water interface to the underwater camera, like a periscope. In order to remain rigid at depth, the wedge is filled with distilled water.Figure 1. Schematic drawing of the profile camera in partial cross section showing the cradle in the down position intersecting the bottom. A- slack winch-wire; B- oil-filled cylinder; C- piston rod; D- piston containing a small diameter hole; E- battery housing with magnetic reed switch, F- lead weights, G- camera (oriented vertically); H- light; I- Plexiglas guillotine filled with distilled water; J- sediment-water interface; K- 45° angle mirror reflecting the sediment-water interface profile 90° to the camera lens. Taken from Rhoads and Cande (1971).
Their device returned images such as that shown in Figure 2. At first glance SP images may appear unremarkable, but analysis of dozens of images allows the breadth of information they contain to become apparent. In Figure 2 the gross texture and water content of the sediment is immediately apparent. Since resolution allows imaging of individual sand grains, the classic textural parameters (percentage of gravel, sand, and mud) can be assessed and a mean grain size estimated. The sediment-water interface is clear. If the image was taken immediately upon insertion, this observation indicates that the device entered the seabed with little disturbance. Furthermore, the interface is distinct. While seemingly straightforward, some seabeds have, instead, a boundary layer of suspended sediments with a broad density gradient instead of a discrete transition point. This condition has a fundamental importance to many benthic organisms. Biological activity is readily apparent as well. When calibrated using traditional grab samples or cores coupled with a few SP images, resolution allows identification of some infauna including the tubicolous sabellid polychaetes, a bisected nereid, and the mound produced by a sea cucumber seen in Figure 2.
Figure 2. Sediment profile photograph of a mud bottom 35 m deep in Cape Cod Bay, Massachusetts. The place of the photograph passes through a fecal mound produced by Molpadia oolitica (holothurian). The apex of the cone is populated by the sabellid polychaete Euchone incolor (A). An errant polychaete has been cut by the guillotine (B). Void spaces at depth are produced by the feeding activities of M. oolitica (C). Light-coloured oxidized (sulfide-poor) sediment extends about 3 cm below the sediment surface. Taken from Rhoads and Cande (1971).
Another significant feature of Figure 2 is the distinct colour change between surface sediments and those deeper. This gradient of colour change, though continuous, is known as the apparent redox potential discontinuity depth (ARPD) when reduced to an average transition point. When properly considered in conjunction with local geology and bioturbation levels, the depth and character of the ARPD can provide profound insights into the interactions between sediment geochemistry and biologic activity. Graf’s review (1992) supports the early observations of Jorgensen & Fenchel (1970) that sediments can be divided into oxic, suboxic, and anoxic levels with fundamental consequences for biota. They defined these boundaries as occurring at the >300 mV (oxidation reduction potential) level for oxic and less than 100 mV for anoxic chemoclines (with suboxic in between) as presented in Figure 3. The vertical position of these boundaries can vary seasonally and locally in response to detrital supply and mixing (due to bioturbation or physically mediated mixing) as fast as 1 cm d-1. Anoxic sediments tend to be toxic to most animals because of free H2S and low pH. In this reducing environment, heavy metals can also precipitate. Some heavy metals, like cadmium and copper, are stabilised as sulphides and do not readily dissolve, but can be remobilised quickly and pollute boundary layer water if oxic conditions are restored (Graf 1992). The sediment penetration of chemical species from overlying waters to these layers will depend heavily upon the size and shape of sediment grains. Using a fluid bromide tracer, Dicke (in Graf 1992) found molecular diffusion alone to penetrate soft sediments to 4 cm in one day and 8 cm after 4 days. Bioturbation can accelerate this process by up to a factor of ten. Thus, the chemoclines affect and are, in turn, affected by benthic organisms. Besides exclusion and bioturbation effects of aerobic organisms, Fenchel and Riedl (1970) pioneered investigations into an unusual fauna inhabiting the suboxic regions of sediment. Clearly, SPI tools have much to offer in investigations of this sort.
Figure 3. The redox potential discontinuity (RPD) - layer concept of Fenchel & Reidel (1970). The sediment is divided into anoxic, suboxic, and oxic layers. Along the walls of tubes and burrows of animals the redox isolines are depressed (cf. Jorgensen & Revsbech, 1985). According to micro-electrode measurements of oxygen, the so-called oxic layer does not really contain free oxygen over the entire depth. Figure taken from Graf (1992).
Rhoads and Germano (1982) developed a list of parameters taken from SPI in an effort to reduce and quantify specific environmental attributes and make them amenable to traditional statistical analysis. Their list has been modified and qualified throughout the literature, but is summarised in Table 1. A few of these parameters can be calibrated and are reproducible in a variety of habitats. Gross sediment texture is probably the least controvertible and most immediately informative parameter for producing benthic habitat maps and identifying sediment-modifying impacts. The apparent redox potential discontinuity (ARPD) can also be a powerful assessment parameter. For example, one of the reported effects of sustained aquaculture activity on coastal environments is the deposition and accumulation of organic-rich sediments near the production site whether from the faeces and pseudofaeces of shellfish or uneaten food and excretion of fin fish. This can result in an increase in oxygen consumption by the sediment, formation of anoxic sediments, and the production and release of harmful gases such as methane, H2S, and CO2 which can affect the water column, benthic macrofauna (Pocklington et al. 1994), and meiofauna (Mazzola et al. 1999).
The relationships between infauna, suboxic sediments, and organic enrichment are well documented (Weston 1990; Rees et al. 1992; Hargrave et al. 1997). This system is much like that described by Pearson and Rosenberg (1978) as presented in Figure 4. Rhoads and Germano (1982) took this concept one step further by assigning categories to the various successional stages in an attempt to integrate the biotic and geochemical responses to organic enrichment. To be used reliably, successional stage determinations must be made within the biological and physical context of each study, are necessarily subjective, and are unlikely to be more than broadly informative between analysts. Similarly, the majority of parameters presented in Table 1 are site- and study-specific. Acting in a similar manner to a cone penetrometer, the SPI wedge penetration depth into soft sediments may be generally useful as a proxy for sediment fabric if calibrated, but results will be sensitive to differences in equipment and deployment.
Table 1
| PHYSICO-CHEMICAL SPI PARAMETERS | Observation |
|---|---|
| Grain size | usually estimated visually; coarser sediments may be quantified through automated particle analysis |
| Prism penetration depth | as a proxy for sediment fabric |
| Mud clasts | number, size, oxidized or reduced |
| Sediment surface relief | must allow for image orientation/scale |
| Redox area/depth | ARPD |
| Redox contrast | Relict redox boundaries |
| Methane gas vesicles | number, size, depth |
| Hydrocarbons | H-spots (Diaz et al. 1993), or spectroscopically (Rhoads et al. 1997) |
| Site-specific observations | |
| Biological SPI Parameters | |
| Epifauna | number, taxa |
| Tube density | number per linear centimetre |
| Feeding voids | epifaunal, infaunal, mixed, area |
| Apparent species richness | .... |
| Successional stage | I, II, or III defined in relation to the Pearson-Rosenberg model and that of Rhoads and Germano (1982) |
| Site-specific observations | particular fauna, bacterial mats, etc. |
Figure 4. Diagram of changes in fauna and sediment structure along a gradient of organic enrichment (Pearson and Rosenberg 1978).
Even with these limitations SPI can be an extremely powerful analytical, reconnaissance, and monitoring tool. Sediment-type maps have often been constructed by retrieving grab or core samples followed by days or weeks of laboratory-based processing. After an SPI device is lowered into the sediment and the image recorded, it can be hauled up and lowered repetitively without fully recovering the device. Such a vessel ‘stitching’ an SPI device along a prescribed route can survey an area with unprecedented economy compared to physical sample recovery. There is, of course, a trade-off between sampling data quality and quantity. SPI allows much greater spatial coverage for a given amount of field time at the cost of the detailed sediment descriptors typically produced from physical cores (half phi interval texture analysis, carbon content, etc.). Managing this balance is the essence of good SPI use and highlights its strengths. For example, Hewitt et al. (2002), Thrush et al. (1999), and Zajac (1999) call attention to the value of integrating macrofaunal community observations collected at different scales and their application in describing processes occurring at different scales within a heterogeneous benthic landscape. When evaluating landscape-scale questions it is rarely feasible to simply and comprehensively sample the total spatial extent with dense, equivalently detailed sampling points. The researcher must compromise between data collection grain, dimensions of the actual sampling unit (typically 0.1 m2 grab or similar), and lag- distance between sample units over which results will be interpolated (often tens to hundreds of metres for grab samples). Sediment profile imagery can be an efficient monitoring tool when coupled with more detailed sampling techniques such as macrofaunal core sampling, or continuous sediment survey transects (Gowing et al. 1997). It offers point data that can be economically collected at sufficient frequency to connect more resource-intensive samples in an ecologically meaningful way. A study can therefore operate at nested spatio-temporal scales with SPI providing overall maps and connectivity while other sampling techniques are used to characterise assemblages and variability within habitat types. This type of integration is necessary for developing our understanding and predictability of soft-sediment processes (Thrush et al. 1999; Noda 2004).
Benthic disturbance mapping
SPI has been used to model the integrity and performance of capped dredge-spoil sites (NOAA 2003) and containment sites (e.g. Parliamentary-Commissioner 1995; Gowing et al. 1997). Detailed acoustic surveys of spoil disposal sites are inherently limited to a vertical resolution of ca. 10 cm (Ramsay 2005). There is considerable evidence that spoil overburden of less than 10 cm affects macrofaunal species (Chang and Levings 1976; Maurer et al. 1982; Maurer et al. 1986; Chandrasekara and Frid 1998; Schratzberger et al. 2000; Cruz-Motta and Collins 2004). Backscatter and high-frequency side-scan sonar techniques may provide faster characterisation of spoil extent, but only when the spoil’s acoustic reflectivity or topology is sufficiently distinct from native sediments. SPI devices produce imagery of the sediment/water interface with sub-millimetre resolution. SPI therefore offers the capability to examine dredge spoil mound morphology, compaction, winnowing, integration with native sediments, and, potentially, biological activity at a scale relevant to the macrofaunal assemblages under study.SPI can be applied to other, perhaps more common, benthic disturbance investigations as well. To illustrate, consider a benthic ecological impact study for a hypothetical shellfish mariculture facility. There are an enormous variety of study approaches. Existing information and the available resources inevitably constrain every design. With little information on bottom type, a simple, one-off, spatial impact study like that shown in Figure 5 with eight sites along an isobath, taking three replicate grabs from each, is fairly common and moderately powerful. Prior data gathering including bathymetric, diver, towed-camera, ROV, or side-scan sonar observations would probably alter site placement and greatly enhance overall information and value. Collecting such data over even a small site such as this one requires considerable resources and will probably cause a gap of several days to allow data processing between the first field days and the grab sampling events (It is this delay that precludes, or reduces, the value of studying transient events in hydrodynamically energetic areas). Collecting a large number of point data from an SPI device is easily done where the resulting snapshots of the benthic character are automatically placed on a map of the study area in real time. This approach allows rapid categorisation according to one or more variables of interest. In waters <30 m deep it is not unreasonable to expect to collect the 170 SP images indicated in Figure 6 and produce a rough benthic classification map in a single field day. The categories may be based on sediment texture, overburden, specific detritus, biota, etc. Sampling effort can then be allocated to focus on the variability of communities among the gross habitat differences by using grabs as habitat replicates with varying lag. This type of approach produces a broader understanding of the system and permits more informed decisions by increasing the generality of the grab sample data. The SPI evidence can effectively increase the extent from one dimension to at least two. Correlation between physical and biological data collected from the grabs also allows more data to be extracted from the SP imagery by identifying specific features (infaunal species, tubes, mounds, etc.). Furthermore, a detailed analysis of ARPD depths can then be presented as geochemical environment contours.
Figure 5. An example of a typical mussel farm sampling protocol (x = grab collection) without a habitat-type map.
Figure 6. An example of relocating the same grab sample effort (as in figure FARM1) in response to habitat-type data collected by an SPI device in order to evaluate interpolation assumptions and increase the extent of the findings.
Rhoads and Germano (1982) compare SPI techniques with three other studies off the east coast of the USA. Their work put SPI within an accepted ecological framework and subsequently widened its appeal and value as a standard monitoring tool. Solan et al. (2003) review the broader conceptual shift from traditional “kill ‘em and count ‘em” methodologies in benthic studies and show how integrating SPI and other optical and acoustic technologies with traditional sampling has fundamentally added to our understanding of several benthic processes. Although most SPI studies remain in the ‘grey literature’ (Keegan et al. 2001), a growing number and variety of applications is appearing. SPI-produced data were as informative as macrofaunal samples along an organic enrichment gradient in a temperate system (Grizzle and Penniman 1991). Other studies include those by Germano (1992) who investigated dredge-spoil disposal in Auckland’s Hauraki Gulf, and Heip (1992) who summarised the value of SPI alongside meio- and macrofaunal sampling near an ocean drilling platform off the German Bight. Rumohr and Schomann (1992) found that the SP imagery provided important clues and context for interpretation of otherwise enigmatic benthic data. Early work using SPI to identify hydrocarbon contamination (Diaz et al. 1993) was later refined to include more accurate and precise measurements by spectroscopy (Rhoads et al. 1997). Smith et al. (2003) investigated fishing trawl impacts using SPI, whilst Solan and Kennedy (2002) demonstrated the use of time-lapse SPI for quantifying ophiuroid bioturbation. Diaz and Cutter (2001) used the same method for quantifying polychaete bioturbation through transient burrow formation and its relationship with oxygen penetration into sediments. NOAA (2003 and references therein) report the widespread use of SPI for habitat mapping, dredge material cap monitoring, and oxygen stress (Nilsson and Rosenberg 1997) in estuarine, coastal, and deep water environments. Beyond pure research, SPI is a technique well suited to tiered monitoring and compliance. It is now widely accepted as a standard technique (Rhoads et al. 2001). Clearly, the applications of SPI are diverse and scientifically robust when properly applied, but some practical problems limit its wider use. Keegan et al. (2001) summarise that SPI is “...not developed as a replacement for conventional benthic monitoring tools, but as a survey and reconnaissance technique to optimise the efficiency of benthic monitoring programs.” They further state:
“...SPI is only now getting the widespread recognition it deserves. While this has something to do with acknowledged limitations in image interpretation, there remain certain impediments linked to the size and weight of the device, as well as to its restriction to use in muds and muddy sands. The relatively high cost of the most basic SPI assembly is perhaps most telling of all...SPI has tended to be used in activities promoted more by government and the wealthier commercial environmental consultancies than by the more traditional research sector.”
Development of the SPI-Scan system http://www.benthicscience.com/bshome.htm, also known as rSPI (rotational SPI) by Brian Paavo and Benthic Science Limited addresses the problems of mass and expense to enable lake and coastal users to economically deploy SPI systems from small vessels.
SPI-Scan a new kind of SPI
In order to form and test fundamental community ecology hypotheses or address applications such as impact assessment, conservation, and exploitation of the marine environment, one needs to investigate the complex interactions between sediments, organisms, and water. A host of burgeoning technologies are slowly gaining acceptance to measure and explore this dynamic interface through biological, chemical, and physical approaches. Viollier et al. (2003) and Rhoads et al. (2001) provide overviews of this topic though the technologies involved and the standards used are changing rapidly. Several techniques have allowed benthologists to address ‘big-picture’ questions of geochemical-biological interactions and ecosystem functioning. Betteridge et al. (2003) used acoustic technology to measure sedimentary dynamics in situ at a scale relevant to macrofauna. Their benthic landers recorded water velocities near the seabed while simultaneously quantifying sediment disturbance patterns in high resolution. Benthic chambers have been used to examine the productivity of realistic macrofaunal assemblages under different flow regimes (Biles et al. 2003). Isotopic analysis methods permit food-web and environmental impact investigations (e.g. Rogers 2003; Schleyer et al. 2006) impossible to conduct outside of a laboratory only a few years ago. Short-sequence DNA methods (e.g. Biodiversity Institute of Ontario 2006) are rapidly moving toward automated identification and diversity assessment techniques that hold the promise of revolutionising benthic ecology.Keegan et al. (2001) described the relationships among workers and authorities evaluating long-established, though often expensive and slow, methodologies with more recent technological developments as sometimes discordant. Gray et al. (1999b) lamented that there is a strong institutional tendency for sediment ecologists to rely on sampling methods developed in the early 1900s! A fine balance needs to be struck. Some degree of paradigm inertia is necessary to maintain intellectual continuity, but it can be taken too far. Physics, as a science, confronted this issue long ago and has widely embraced new technologies after establishing a scientific culture of always linking new techniques to established findings in a period of calibration and evaluation. The pace of this process in biology, as a whole, has quickened over the past few decades and ecology has only recently come to this horizon. This article introduces one such technology, sediment profile imagery (SPI) that is slowly gaining acceptance and currently undergoing its evaluation and calibration period even though it has existed since the 1970s. Like many of the technologies mentioned above, each new capability requires a careful consideration of its appropriateness in any particular application. This is especially true when they cross important, though often subtle, boundaries of data collection limitations. For example, much of our benthic knowledge has been developed from point-sample methods like cores or grabs, whereas continuous data collection, like some video transect analysis methods (e.g. Tkachenko 2005), may require different spatial interpretations that more explicitly integrate patchiness. While remote sampling techniques often improve our point-sampling resolution, benthologists need to consider the real-world heterogeneity at small spatial scales and compare them to the noise inherent to most high-volume data collection methods (e.g. Rabouille et al. 2003 for microelectrode investigations of pore water). New developments in the field of SPI will provide tools for investigating dynamic sediment processes, but also challenge our ability to accurately interpolate point-data collected at spatial densities approaching continuous data sets.
SP imagery as embodied in the commercial REMOTS system (Rhoads et al. 1997) is expensive (>NZ$60,000 at time of writing), requires heavy lifting gear (ca. 66-400 kg with a full complement of weights to effectively penetrate sediments), and is limited to muddy sediments. REMOTS is not well suited to small research programmes, nor operation in shallow water from small vessels, which is, quite possibly, an area where it could be most useful. Studying shallow sub-tidal environments can be a challenging exercise, especially among shifting sands. Macrofaunal sampling usually occurs at the sub-metre scale, whilst the dominant physical factors such as wave exposure and sediment texture can change at a scale of only metres, even though they are often only resolved to a scale of hundreds of metres. In such a dynamic environment, monitoring potentially transient disturbances like a spoil mound requires benthic mapping at fine spatial and temporal scales, an application ideally suited to SPI.
Design concept
The defining characteristic of antecedent SPI devices is the prism containing the transparent face, mirror, and distilled water, whether the device descends into sediments like a periscope or is towed through the seabed like a plough (Cutter and Diaz 1998). Pushing anything into sediment requires displacing sand grains and replacing them with the imaging device without disturbing the neighbouring sediment layers that need to be imaged. Using a wedge to displace the sediments requires considerable structural integrity and force, which increases the size, weight, and cost of building and deploying it. A smaller wedge would, of course, reduce those requirements, but at the unacceptable cost of an extremely small sampling area (typical SPI devices image about 300 cm2). The mirror further restricts the shape of the wedge. Unless radical and expensive optics are used to alter the light path geometry, a 45° angle must be maintained between the sediment face and the plane of the camera. These restrictions dictate an SPI prism as an inclined plane (that is a triangular prism containing one right angle). Pushing the SPI prism into sediments is doing physical work, defined by the classic equation:W = Fd
where W = work, F = force, and d=distance. Displacing any sediment grain requires a certain amount of work to overcome both inertia and the friction generated by all adjacent grains (both static and dynamic). The wedge does displacement work by using less force at the cost of increasing the distance the grain must travel. In order to reduce the size of an SPI device it makes sense to reduce the amount of work required to displace sediment for a given imaging area. Being in an aquatic environment gives the first advantage to reducing work. By increasing the water content of sediments, both static and dynamic coefficients of friction from grain-on-grain interactions are greatly reduced. At these large physical scales, viscosity interactions are very small compared to friction. Therefore, fluidising sediments would allow an SPI device to displace more and coarser sediments with less downward force. (Of course all mass-energy is conserved – more work is required to pump the water into sediments – but at least that can be done away from the wedge.) It is important to cleanly separate sediments to be fluidised and removed from the sedimentary fabric that must be imaged intact.
Water lubrication can be used to reduce the amount of force required and lessen required workload, but can we also reduce the distance grains need to be displaced? The imaging mirror is the greatest constraint to reducing grain displacement so it makes sense to dispense with it. A number of commercial and consumer line scanners exist which digitise an image by moving in a plane recording the colour and intensity of light encountered. Flatbed scanners and digital photocopiers are examples of this technique. Light shining from the device reflects off the scene to be imaged to a sensor located near the light source. The light’s path can be folded and manipulated by a series of intermediary mirrors and lenses to a small linear sensor array or directly to a large array of tiny sensors. Pushing a thin flatbed scanner into sediments requires much less work than pushing a large prism, as concluded by Keegan et al. (2001):
“In terms of its current design, the size of the prism in the SPI array impedes penetration in all but the softer, less compact sediments. When, for the sake of enhanced penetration, it becomes necessary to use the full complement of lead weights (66kg), the system becomes difficult to handle on smaller craft with restricted lifting equipment. Size and, correspondingly, weight could be reduced if the prism could be replaced to act more as a slim ‘digging blade,’ the whole exposed face of which could be digitally scanned in situ. Such a blade would not only facilitate easier and deeper penetration but also extend the use of SPI to more compact, fine to medium sands. The authors have already experimented with a suitable casing that penetrated these more resistant deposits to depths exceeding 55cm, however, a physically robust scanner that will tolerate the shock of impact and have a level of resolution adequate to the purpose remains to be identified.”
The engineering problems of resolution, weight, and pressure and shock-resistance are compounded by keeping the scanner in a rectangular configuration (Patterson et al. 2006). Most underwater equipment is housed in cylinders because cylinders present a smaller surface area for enclosing a given volume than a rectangular enclosure. For a given surface (imaging) area, fewer sediment grains will need to be displaced a shorter distance when imaged from the perimeter of a cylinder than the oblique face of a wedge. It is a conceptually simple matter to modify a consumer flatbed scanner so that its scan head (containing light source and sensor array) moves in a circular path instead of a plane as illustrated in Figure 7. This configuration change allows for a more efficient wedge geometry or, as we’ll see later, permits its elimination.
Figure 7. Changing the scan head path from the typical plane found in consumer scanners to a circular path allows imaging of the same area with a much smaller perpendicular plan area (which is the face that must penetrate sediments). This configuration also allows use of the mechanically superior (under external pressure) cylinder rather than a box.
First prototype
The goal was to obtain the greatest imaging area in the smallest cylindrical volume using a consumer flatbed scanner. Typical flatbed scanners image an area of about 220 x 300 mm (660 cm2), so a system had to be found which could be reconfigured to fit inside a sealed transparent capsule. There are two basic imaging methods in modern flatbed scanners. From the 1980s to the late-1990s the market was dominated by systems that could capture an image from any depth of field. Most such digital imaging devices used a Charge-Coupled Device (CCD) array. In a CCD, discrete dots of photosensitive material produce a specific charge based on the intensity of light hitting it. A CCD does not detect colour. In this technology, a scene is illuminated, a narrow band of reflected light from the scene passes through a slit (to eliminate light coming from other directions), is then concentrated by an array of mirrors (typically folded into a box) into a prism typically a few centimetres in length. The prism splits the light into its constituent colours. Small CCD arrays are carefully placed at the point where the primary colours are sharply focused. The separate colour intensities are combined to composite values and recorded by the computer (or scanner electronic assemblies) as a line of pixels. The moving scan head then advances a short distance to gather the next line of the scene. Thus resolution in one axis is determined by CCD array size and focused optics, while the other axis’ resolution is determined by the smallest reliable step the scan head advancing motor can make. The optical assemblies of this type of scanner are fairly robust to vibration, but the traditional light source (a cold cathode tube of balanced colour temperature) is not. It was therefore replaced with an array of solid-state white light emitting diodes (LEDs). Another advantage of this replacement is that the sources could be alternated between white light and ultraviolet (UV) of about 370 nm wavelength. This UV light source allowed detection of visibly fluorescing materials (typically tracer minerals or hydrocarbons) by the prototype.A suitable scan head model that could be reconfigured to fit within an 80 mm diameter cylinder was located, and the scanner’s standard stepper motor was modified to fit within the same space. The entire unit was then mounted on a stainless steel pivot and rotated by a spring-loaded friction wheel pressing against the inner wall of the cylinder. Since the perimeter of the cylinder (250 mm) was smaller than the typical scan path (300 mm) the motor gearing was reduced to improve along-path scan resolution, the resulting change in image geometry was relatively easy to correct in the image capture software. The resulting assembly is shown in Figure 8.
Figure 8. This is the scanning module of the first SPI-Scan sediment profile imager. A) stepper-motor, gearing, and friction wheel assembly, B) scan head with modified electronics mounted on the non-imaging surfaces. NOTE: This photo was taken using a wide-angle lens, producing distortion.
The tight fit of the electronics required fairly close internal tolerances and the transparent cylinder needed to fit within an external armour cylinder with closer tolerances. The latter was necessary to avoid gaps between the sediment face to be imaged and the imaging plane. Gaps allow sediments to fall or smear and degrade the scientific value of the sediment profile. Stainless steel automobile exhaust tubing swaged by a hydraulic ram using a custom turned stainless steel (316) cone was ultimately used. Portals were cut into the centre section to allow imaging of a 210 x 150 mm area divided among four windows.
In order to inject water into sediments so as to displace some but not disturb others a penetrating head was cast and plumbed. A number of penetrating head geometries were explored using a series of ¼ scale models attached to a penetrometer and forced into sandy sediments under water. A sharply angled plane with an offset conic section removed was chosen as the most efficient. With this configuration, the head first separated (by force) the sediments to be displaced while supporting the sediments of the bore wall. A vortex of water was created by angled water jets in the conic space. This design massively disturbed sediments in one ‘exhaust’ sector of the SPI image, but minimised disturbance in the remainder. The penetrator head was made by first carving 1.5 kg of butter into the desired shape, then casting a negative in plaster-of-Paris, water jets (copper tubing) were mounted within the mold, the assembly was dried in an oven at 70°C for three days, and then positively cast using about 7 kg of molten lead. The final penetrator head is shown in Figure 10. Prior to deployment the device required a tether providing electrical and mechanical connections to the surface vessel and a frame to ensure that it entered the seabed perpendicularly.
Figure 10. A) displacement-aspect of penetrator head showing water jet placement, B) side-view, C) diagram of jet-induced water flow pattern to fluidise sediments and encourage them to move up and out of the bore hole, D) Top view (perpendicular to viewing plane) showing area of disturbed (1) and undisturbed sediments, E) final casting for prototype.
The first prototype was constructed as a proof-of-concept exercise. The glass cylinder was unlikely to survive repeated use in the field. The device was subjected to a simulated SPI application: spoil mound cap monitoring. A 450 l drum was filled with fine sand from a local beach. Glutinous silt and clay-sized material was then laid down in discrete layers with the sand. A coarse-sand ‘cap’ was then laid on top and the whole drum filled with seawater. Penetration was satisfactory (13 cm of image, another 15 cm for the penetrator head), but resolution was poor as expected.
Second prototype
Experience building and testing the first prototype identified a number of key issues. The scanner technology chosen provided great depth of field (useful for identifying surface features), but required a large volume for the mirror assembly (which had to be strengthened to withstand vibrations). Furthermore, the armour, support flanges, and water pipes limited further sediment penetration and caused sediment disturbance. It was desirable to move the entire water gallery into the centre of the scanner module so that penetrator heads could be rapidly changed in the field. It was likely that different shapes would be more effective in different sediment textures and fabrics.These decisions led to an alternate scanner technology that had been developed and marketed mostly in the early 2000s. It is known by various names such as contact imaging, direct imaging, or LED indirect exposure (US Patent 5499112). In this technology, a string of LEDs strobe the primary colours onto an imaging plane. Illumination is crucial so the imaging plane must be close. Reflected light from the imaging plane is directed into an array of light guides which lead to CCD elements. The physical arrangement between the light guides and the imaging plane is what limits the depth of field using this technology. Tests using consumer scanners indicated that the imaging plane could be 1-3 mm away from the scan head for full resolution images, but dropped off quickly beyond that. Scene features 5 mm or more away from the scan head were almost unidentifiable. Since the primary value of SP imagery is two-dimensional, this limitation was a small trade off for the great savings in space. The solid-state technology is robust to vibration and no mirrors are necessary. Unfortunately, UV illumination was difficult to provide without a custom-designed scan head and was therefore not included in the second prototype.
One major advantage of SPI is that it reliably provides sediment information regardless of water clarity. However, many SPI applications such as habitat mapping and side-scan sonar ground-truthing, would benefit from imagery of the seabed’s surface when visibility permits. Since the tether provided a source of power and computer connectivity with the surface vessel, adding a digital camera to image the seabed surface immediately adjacent to the sediment profile was another conceptually simple addition. A laser array surrounding the camera provided a means to correct the geometry of the seabed surface image (since it is captured at a variable angle) and its scale. Such imagery provides a larger reference frame in which to interpret the adjacent sediment profile and permits a more informed estimation of the habitat connectivity of multiple profiles. A longitudinal section of the second prototype with the seabed surface camera is presented in Figure 11. The typical deployment configuration is shown in Figure 12.
Figure 11. A longitudinal section through the second prototype SPI-Scan imager produced by Benthic Science Limited. A) electronics space, B) motor/gearing assembly connected to vertical drive shaft, C) one of five lasers, D) seabed surface CCD, E) camera pod, F) scan head, G) field-changeable penetrator with water galleries and jets, H) field-changeable cutting blade, I) scan head holder, J) central pressurised water gallery, K) transparent polycarbonate cylinder, L) water pump.
Figure 12. Diagram of second prototype (one leg of frame removed for clarity) as envisioned in situ with scale/geometry lasers active emanating from surface camera pod.
Field trial results
Several decisions during the design phase affected the ultimate utility of this device. The REMOTS system is well suited to providing point SP imagery in deep water from large vessels. SPI-Scan prototypes were specifically intended for shallow water work from small vessels. Although the design can be modified to work deeper, a 50 m tether was used to allow effective operations in 30 m of water. Field tests were first conducted in 29 m water depths from the R/V Munida of the University of Otago Department of Marine Science.Figure 13. The second prototype in field trials. Seen here deploying from the 6 m R/V Nauplius (upper left), on the seabed though locked in the up position (upper right and lower left – lasers not visible here), and starting to dig into the sand (lower right).
The next set of sea trials were conducted near an aquaculture facility from a 5 m research vessel. Seventy-eight images from about 20 deployments were collected. Figure 14 presents two representative images. The digital images carry much more detail than reproduced here as Figure 15 demonstrates.
Figure 14. Here are two portions of sediment profiles taken 1 km from an aquaculture facility along the tidal current (left) and across (right). The right hand scale divisions are 1 mm apart.
Figure 15. Portions of images in figure 14 are shown in panels 6, 7, and 8. Sediment texture is detailed in panel 6, a polychaete worm is evident in panel 7, and panel 8 shows Echinocardium (heart urchin) shell fragments in silt matrix. Panel 9 shows a diver giving the ‘thumbs up’ sign to the scanner to illustrate the limited depth of field of the second prototype. Poor water visibility is also in evidence by the heavy background lighting. All scale divisions are in millimetres.
The surface computer stamped the date and time of collection directly onto the SP image. Custom software integrated an NMEA data stream from a GPS connected to the computer’s serial port to also stamp the geographic position of the surface vessel (or of the device if corrected by NMEA output from an acoustic positioning beacon array). The software further uses a modification of the GEOTiff graphic standard to embed geographic position and datum information into the image tags. This permits automatic placement of SPI and seabed surface images into spatially appropriate positions when opening within a GIS package. This functionality allows real time assessment of benthic data in the field to inform further sampling decisions.
Future directions
Field trials have proven that the device produces usable images (image analysis is a separate topic covered in the broader literature). The technology is substantially more cost-effective than other existing SPI devices and able to be deployed from small vessels (ca. 5 m) by two persons operating a light frame or davit. Development of the device continues with better penetration geometries and technologies, more hydrodynamic housings, and extra sensor options. Koenig et al. (2001) reviewed some exciting developments in optical sensors (also known as optodes or reactive foils) capable of resolving sub-centimetre oxygen distribution (using the non-consumptive ruthenium fluorescence method) and pH. Very small redox (Eh) probes have also been available for quite some time. Vopel et al. (2003) demonstrated the utility of combining such instruments in studying animal-sediment interactions. These instruments can be integrated into the sediment imager relatively easily and would allow absolute quantification of sediment geochemical profiles at a small number of sites to inform the analysis of the surrounding SP images. Adding UV illumination is only a manufacturing issue. UV capabilities could extend the role of SPI in direct pollution monitoring of harbours or assessing the effects of petrochemical spills. SP image resolution is high enough to permit sediment tracer studies without expensive dyeing if the tracer mineral presents unique colour or fluorescence characteristics.Keegan et al. (2001) pointed out that chemical and physical environmental measurements alone are easily quantified and readily reproducible, but are overall poor monitors of environmental health. Biological and ecological theory is well enough advanced to be a full partner in environmental legislation, monitoring, and enforcement (Karr 1991) and can provide the appropriate local context for interpretation of physico-chemical results. In a typical assessment of mariculture impacts on the benthos Weston (1990) found that sediment chemistry (CHN, water-soluble sulfides, and redox measures) measures of organic enrichment effects extended only 45 m from the farm, but benthic community effects were apparent to 150 m. SPI can elucidate many of these important biological parameters. Benthic Science Limited continues development of SPI-Scan technology.