
Robust regression
Encyclopedia
In robust statistics
, robust regression is a form of regression analysis
designed to circumvent some limitations of traditional parametric
and non-parametric methods
. Regression analysis seeks to find the effect of one or more independent variables upon a dependent variable. Certain widely used methods of regression, such as ordinary least squares
, have favourable properties if their underlying assumptions are true, but can give misleading results if those assumptions are not true; thus ordinary least squares is said to be not robust to violations of its assumptions. Robust regression methods are designed to be not overly affected by violations of assumptions by the underlying data-generating process.
In particular, least squares
estimates for regression models are highly non-robust to outliers. While there is no precise definition of an outlier, outliers are observations which do not follow the pattern of the other observations. This is not normally a problem if the outlier is simply an extreme observation drawn from the tail of a normal distribution, but if the outlier results from non-normal measurement error or some other violation of standard ordinary least squares assumptions, then it compromises the validity of the regression results if a non-robust regression technique is used.
and can be biased. Because the least squares predictions are dragged towards the outliers, and because the variance of the estimates is artificially inflated, the result is that outliers can be masked. (In many situations, including some areas of geostatistics
and medical statistics, it is precisely the outliers that are of interest.)
Although it is sometimes claimed that least squares (or classical statistical methods in general) are robust, they are only robust in the sense that the type I error rate
does not increase under violations of the model. In fact, the type I error rate tends to be lower than the nominal level when outliers are present, and there is often a dramatic increase in the type II error rate
. The reduction of the type I error rate has been labelled as the conservatism of classical methods. Other labels might include inefficiency or inadmissibility.
Although uptake of robust methods has been slow, modern mainstream statistics text books often include discussion of these methods (for example, the books by Seber and Lee, and by Faraway; for a good general description of how the various robust regression methods developed from one another see Andersen's book). Also, modern statistical software packages such as R
, Stata
and S-PLUS
include considerable functionality for robust estimation (see, for example, the books by Venables and Ripley, and by Marrona et al.). It is possible that these methods will come into wider use in the future.
. Even then, gross outliers can still have a considerable impact on the model, motivating research into even more robust approaches.
In 1973, Huber introduced M-estimation
for regression (see robust statistics
for additional details of M-estimation). The M in M-estimation stands for "maximum likelihood type". The method is robust to outliers in the response variable, but turned out not to be resistant to outliers in the explanatory variables (leverage points). In fact, when there are outliers in the explanatory variables, the method has no advantage over least squares.
In the 1980s, several alternatives to M-estimation were proposed as attempts to overcome the lack of resistance. See the book by Rousseeuw
and Leroy for a very practical review. Least trimmed squares
(LTS) is a viable alternative and is presently (2007) the preferred choice of Rousseeuw and Ryan (1997, 2008). The Theil–Sen estimator
has a lower breakdown point than LTS but is statistically efficient and popular. Another proposed solution was S-estimation. This method finds a line (plane or hyperplane) that minimizes a robust estimate of the scale (from which the method gets the S in its name) of the residuals. This method is highly resistant to leverage points, and is robust to outliers in the response. However, this method was also found to be inefficient.
MM-estimation attempts to retain the robustness and resistance of S-estimation, whilst gaining the efficiency of M-estimation. The method proceeds by finding a highly robust and resistant S-estimate that minimizes an M-estimate of the scale of the residuals (the first M in the method's name). The estimated scale is then held constant whilst a close-by M-estimate of the parameters is located (the second M).
Under the assumption of t-distributed residuals, the distribution is a location-scale family. That is, . The degrees of freedom of the t-distribution is sometimes called the kurtosis parameter. Lange, Little and Taylor (1989) discuss this model in some depth from a non-Bayesian point of view. A Bayesian account appears in Gelman et al. (2003).
An alternative parametric approach is to assume that the residuals follow a mixture of normal distributions; in particular, a contaminated normal distribution in which the majority of observations are from a specified normal distribution, but a small proportion are from a normal distribution with much higher variance. That is, residuals have probability of coming from a normal distribution with variance
  , where
  is small, and probability
  of coming from a normal distribution with variance
  for some

Typically, . This is sometimes called the
  -contamination model.
Parametric approaches have the advantage that likelihood theory provides an 'off the shelf' approach to inference (although for mixture models such as the -contamination model, the usual regularity conditions might not apply), and it is possible to build simulation models from the fit. However, such parametric models still assume that the underlying model is literally true. As such, they do not account for skewed residual distributions or finite observation precisions.
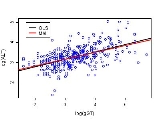
liver data have been studied by various authors, including Breiman (2001). The data can be found via the classic data sets page and there is some discussion in the article on the Box-Cox transformation. A plot of the logs of ALT versus the logs of γGT appears below. The two regression lines are those estimated by ordinary least squares (OLS) and by robust MM-estimation. The analysis was performed in R
using software made available by Venables and Ripley (2002).
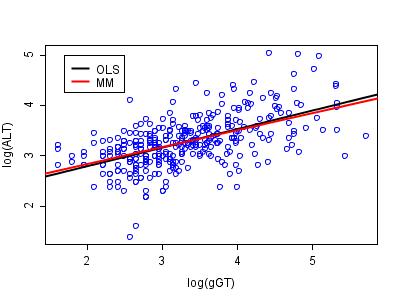
The two regression lines appear to be very similar (and this is not unusual in a data set of this size). However, the advantage of the robust approach comes to light when the estimates of residual scale are considered. For ordinary least squares, the estimate of scale is 0.420, compared to 0.373 for the robust method. Thus, the relative efficiency of ordinary least squares to MM-estimation in this example is 1.266. This inefficiency leads to loss of power in hypothesis tests, and to unnecessarily wide confidence intervals on estimated parameters.
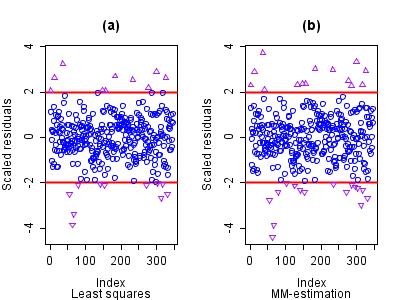
The horizontal reference lines are at 2 and -2 so that any observed scaled residual beyond these boundaries can be considered to be an outlier. Clearly, the least squares method leads to many interesting observations being masked.
Whilst in one or two dimensions outlier detection using classical methods can be performed manually, with large data sets and in high dimensions the problem of masking can make identification of many outliers impossible. Robust methods automatically detect these observations, offering a serious advantage over classical methods when outliers are present.
Robust regression is available in many statistical software packages:
Robust statistics
Robust statistics provides an alternative approach to classical statistical methods. The motivation is to produce estimators that are not unduly affected by small departures from model assumptions.- Introduction :...
, robust regression is a form of regression analysis
Regression analysis
In statistics, regression analysis includes many techniques for modeling and analyzing several variables, when the focus is on the relationship between a dependent variable and one or more independent variables...
designed to circumvent some limitations of traditional parametric
Parametric statistics
Parametric statistics is a branch of statistics that assumes that the data has come from a type of probability distribution and makes inferences about the parameters of the distribution. Most well-known elementary statistical methods are parametric....
and non-parametric methods
Non-parametric statistics
In statistics, the term non-parametric statistics has at least two different meanings:The first meaning of non-parametric covers techniques that do not rely on data belonging to any particular distribution. These include, among others:...
. Regression analysis seeks to find the effect of one or more independent variables upon a dependent variable. Certain widely used methods of regression, such as ordinary least squares
Ordinary least squares
In statistics, ordinary least squares or linear least squares is a method for estimating the unknown parameters in a linear regression model. This method minimizes the sum of squared vertical distances between the observed responses in the dataset and the responses predicted by the linear...
, have favourable properties if their underlying assumptions are true, but can give misleading results if those assumptions are not true; thus ordinary least squares is said to be not robust to violations of its assumptions. Robust regression methods are designed to be not overly affected by violations of assumptions by the underlying data-generating process.
In particular, least squares
Least squares
The method of least squares is a standard approach to the approximate solution of overdetermined systems, i.e., sets of equations in which there are more equations than unknowns. "Least squares" means that the overall solution minimizes the sum of the squares of the errors made in solving every...
estimates for regression models are highly non-robust to outliers. While there is no precise definition of an outlier, outliers are observations which do not follow the pattern of the other observations. This is not normally a problem if the outlier is simply an extreme observation drawn from the tail of a normal distribution, but if the outlier results from non-normal measurement error or some other violation of standard ordinary least squares assumptions, then it compromises the validity of the regression results if a non-robust regression technique is used.
Heteroscedastic errors
One instance in which robust estimation should be considered is when there is a strong suspicion of heteroscedasticity. In the homoscedastic model, it is assumed that the variance of the error term is constant for all values of x. Heteroscedasticity allows the variance to be dependent on x, which is more accurate for many real scenarios. For example, the variance of expenditure is often larger for individuals with higher income than for individuals with lower incomes. Software packages usually default to a homoscedastic model, even though such a model may be less accurate than a heteroscedastic model. One simple approach (Tofallis, 2008) is to apply least squares to percentage errors as this reduces the influence of the larger values of the dependent variable compared to ordinary least squares.Presence of outliers
Another common situation in which robust estimation is used occurs when the data contain outliers. In the presence of outliers that do not come from the same data-generating process as the rest of the data, least squares estimation is inefficientEfficiency (statistics)
In statistics, an efficient estimator is an estimator that estimates the quantity of interest in some “best possible” manner. The notion of “best possible” relies upon the choice of a particular loss function — the function which quantifies the relative degree of undesirability of estimation errors...
and can be biased. Because the least squares predictions are dragged towards the outliers, and because the variance of the estimates is artificially inflated, the result is that outliers can be masked. (In many situations, including some areas of geostatistics
Geostatistics
Geostatistics is a branch of statistics focusing on spatial or spatiotemporal datasets. Developed originally to predict probability distributions of ore grades for mining operations, it is currently applied in diverse disciplines including petroleum geology, hydrogeology, hydrology, meteorology,...
and medical statistics, it is precisely the outliers that are of interest.)
Although it is sometimes claimed that least squares (or classical statistical methods in general) are robust, they are only robust in the sense that the type I error rate
Type I and type II errors
In statistical test theory the notion of statistical error is an integral part of hypothesis testing. The test requires an unambiguous statement of a null hypothesis, which usually corresponds to a default "state of nature", for example "this person is healthy", "this accused is not guilty" or...
does not increase under violations of the model. In fact, the type I error rate tends to be lower than the nominal level when outliers are present, and there is often a dramatic increase in the type II error rate
Type I and type II errors
In statistical test theory the notion of statistical error is an integral part of hypothesis testing. The test requires an unambiguous statement of a null hypothesis, which usually corresponds to a default "state of nature", for example "this person is healthy", "this accused is not guilty" or...
. The reduction of the type I error rate has been labelled as the conservatism of classical methods. Other labels might include inefficiency or inadmissibility.
History and unpopularity of robust regression
Despite their superior performance over least squares estimation in many situations, robust methods for regression are still not widely used. Several reasons may help explain their unpopularity (Hampel et al. 1986, 2005). One possible reason is that there are several competing methods and the field got off to many false starts. Also, computation of robust estimates is much more computationally intensive than least squares estimation; in recent years however, this objection has become less relevant as computing power has increased greatly. Another reason may be that some popular statistical software packages failed to implement the methods (Stromberg, 2004). The belief of many statisticians that classical methods are robust may be another reason.Although uptake of robust methods has been slow, modern mainstream statistics text books often include discussion of these methods (for example, the books by Seber and Lee, and by Faraway; for a good general description of how the various robust regression methods developed from one another see Andersen's book). Also, modern statistical software packages such as R
R (programming language)
R is a programming language and software environment for statistical computing and graphics. The R language is widely used among statisticians for developing statistical software, and R is widely used for statistical software development and data analysis....
, Stata
Stata
Stata is a general-purpose statistical software package created in 1985 by StataCorp. It is used by many businesses and academic institutions around the world...
and S-PLUS
S-PLUS
S-PLUS is a commercial implementation of the S programming language sold by TIBCO Software Inc..It features object-oriented programming capabilities and advanced analytical algorithms.-Historical timeline:...
include considerable functionality for robust estimation (see, for example, the books by Venables and Ripley, and by Marrona et al.). It is possible that these methods will come into wider use in the future.
Least squares alternatives
The simplest methods of estimating parameters in a regression model that are less sensitive to outliers than the least squares estimates, is to use least absolute deviationsLeast absolute deviations
Least absolute deviations , also known as Least Absolute Errors , Least Absolute Value , or the L1 norm problem, is a mathematical optimization technique similar to the popular least squares technique that attempts to find a function which closely approximates a set of data...
. Even then, gross outliers can still have a considerable impact on the model, motivating research into even more robust approaches.
In 1973, Huber introduced M-estimation
M-estimator
In statistics, M-estimators are a broad class of estimators, which are obtained as the minima of sums of functions of the data. Least-squares estimators and many maximum-likelihood estimators are M-estimators. The definition of M-estimators was motivated by robust statistics, which contributed new...
for regression (see robust statistics
Robust statistics
Robust statistics provides an alternative approach to classical statistical methods. The motivation is to produce estimators that are not unduly affected by small departures from model assumptions.- Introduction :...
for additional details of M-estimation). The M in M-estimation stands for "maximum likelihood type". The method is robust to outliers in the response variable, but turned out not to be resistant to outliers in the explanatory variables (leverage points). In fact, when there are outliers in the explanatory variables, the method has no advantage over least squares.
In the 1980s, several alternatives to M-estimation were proposed as attempts to overcome the lack of resistance. See the book by Rousseeuw
Peter Rousseeuw
Peter J. Rousseeuw is a Belgian statistician known for his work on robust statistics and cluster analysis.-Books:...
and Leroy for a very practical review. Least trimmed squares
Least Trimmed Squares
Least trimmed squares , or least trimmed sum of squares, is a robust statistical method that attempts to fit a function to a set of data whilst not being unduly affected by the presence of outliers...
(LTS) is a viable alternative and is presently (2007) the preferred choice of Rousseeuw and Ryan (1997, 2008). The Theil–Sen estimator
Theil–Sen estimator
In non-parametric statistics, the Theil–Sen estimator, also known as Sen's slope estimator, slope selection, the single median method, or the Kendall robust line-fit method, is a method for robust linear regression that chooses the median slope among all lines through pairs of two-dimensional...
has a lower breakdown point than LTS but is statistically efficient and popular. Another proposed solution was S-estimation. This method finds a line (plane or hyperplane) that minimizes a robust estimate of the scale (from which the method gets the S in its name) of the residuals. This method is highly resistant to leverage points, and is robust to outliers in the response. However, this method was also found to be inefficient.
MM-estimation attempts to retain the robustness and resistance of S-estimation, whilst gaining the efficiency of M-estimation. The method proceeds by finding a highly robust and resistant S-estimate that minimizes an M-estimate of the scale of the residuals (the first M in the method's name). The estimated scale is then held constant whilst a close-by M-estimate of the parameters is located (the second M).
Parametric alternatives
Another approach to robust estimation of regression models is to replace the normal distribution with a heavy-tailed distribution. A t-distribution with between 4 and 6 degrees of freedom has been reported to be a good choice in various practical situations. Bayesian robust regression, being fully parametric, relies heavily on such distributions.Under the assumption of t-distributed residuals, the distribution is a location-scale family. That is,
. The degrees of freedom of the t-distribution is sometimes called the kurtosis parameter. Lange, Little and Taylor (1989) discuss this model in some depth from a non-Bayesian point of view. A Bayesian account appears in Gelman et al. (2003).An alternative parametric approach is to assume that the residuals follow a mixture of normal distributions; in particular, a contaminated normal distribution in which the majority of observations are from a specified normal distribution, but a small proportion are from a normal distribution with much higher variance. That is, residuals have probability
of coming from a normal distribution with variance , where is small, and probability of coming from a normal distribution with variance for some Typically,
. This is sometimes called the -contamination model.Parametric approaches have the advantage that likelihood theory provides an 'off the shelf' approach to inference (although for mixture models such as the
-contamination model, the usual regularity conditions might not apply), and it is possible to build simulation models from the fit. However, such parametric models still assume that the underlying model is literally true. As such, they do not account for skewed residual distributions or finite observation precisions.Example: BUPA liver data
The BUPABupa
Bupa is a large British healthcare organisation, with bases on three continents and more than ten million customers in over 200 countries. It is a private healthcare company, in direct contrast to the UK's National Health Services, which are tax-funded healthcare systems and do not require private...
liver data have been studied by various authors, including Breiman (2001). The data can be found via the classic data sets page and there is some discussion in the article on the Box-Cox transformation. A plot of the logs of ALT versus the logs of γGT appears below. The two regression lines are those estimated by ordinary least squares (OLS) and by robust MM-estimation. The analysis was performed in R
R (programming language)
R is a programming language and software environment for statistical computing and graphics. The R language is widely used among statisticians for developing statistical software, and R is widely used for statistical software development and data analysis....
using software made available by Venables and Ripley (2002).
The two regression lines appear to be very similar (and this is not unusual in a data set of this size). However, the advantage of the robust approach comes to light when the estimates of residual scale are considered. For ordinary least squares, the estimate of scale is 0.420, compared to 0.373 for the robust method. Thus, the relative efficiency of ordinary least squares to MM-estimation in this example is 1.266. This inefficiency leads to loss of power in hypothesis tests, and to unnecessarily wide confidence intervals on estimated parameters.
Outlier detection
Another consequence of the inefficiency of the ordinary least squares fit is that several outliers are masked. Because the estimate of residual scale is inflated, the scaled residuals are pushed closer to zero than when a more appropriate estimate of scale is used. The plots of the scaled residuals from the two models appear below. The variable on the x-axis is just the observation number as it appeared in the data set. Rousseeuw and Leroy (1986) contains many such plots.The horizontal reference lines are at 2 and -2 so that any observed scaled residual beyond these boundaries can be considered to be an outlier. Clearly, the least squares method leads to many interesting observations being masked.
Whilst in one or two dimensions outlier detection using classical methods can be performed manually, with large data sets and in high dimensions the problem of masking can make identification of many outliers impossible. Robust methods automatically detect these observations, offering a serious advantage over classical methods when outliers are present.
External links
- R programming wikibooks
- Brian Ripley'sBrian D. RipleyBrian David Ripley is a renowned British statistician. Since 1990, he has been professor of applied statistics at the University of Oxford and is also a professorial fellow at St Peter's College....
robust statistics course notes. - Nick Fieller's course notes on Statistical Modelling and Computation contain material on robust regression.
- Olfa Nasraoui's Overview of Robust Statistics
- Why write statistical software? The case of robust statistical methods, A. J. Stromberg
Robust regression is available in many statistical software packages:
- Robust Regression Modeling Package for the R programming languageR (programming language)R is a programming language and software environment for statistical computing and graphics. The R language is widely used among statisticians for developing statistical software, and R is widely used for statistical software development and data analysis....
- the 'MASS' and 'robust' packages for the R programming languageR (programming language)R is a programming language and software environment for statistical computing and graphics. The R language is widely used among statisticians for developing statistical software, and R is widely used for statistical software development and data analysis....
- S-PLUS statistical software packageS-PLUSS-PLUS is a commercial implementation of the S programming language sold by TIBCO Software Inc..It features object-oriented programming capabilities and advanced analytical algorithms.-Historical timeline:...
- GraphPad PrismGraphPad PrismGraphPad Prism is a commercial scientific 2D graphing and statistics software published by GraphPad Software, Inc., a privately-held California corporation...
can perform robust nonlinear regression.