
Recurrence quantification analysis
Encyclopedia
Recurrence quantification analysis (RQA) is a method of nonlinear data analysis
(cf. chaos theory
) for the investigation of dynamical systems. It quantifies the number and duration of recurrences of a dynamical system presented by its phase space
trajectory.
s (RPs) based on the small-scale structures therein. Recurrence plot
s are tools which visualise the recurrence behaviour of the phase space
trajectory of dynamical systems. They mostly contain single dots and lines which are parallel to the mean diagonal (line of identity, LOI) or which are vertical/horizontal. Lines parallel to the LOI are referred to as diagonal lines and the vertical structures as vertical lines. Because an RP is usually symmetric, horizontal and vertical lines correspond to each other, and, hence, only vertical lines are considered. The lines correspond to a typical behaviour of the phase space trajectory: whereas the diagonal lines represent such segments of the phase space trajectory which run parallel for some time, the vertical lines represent segments which remain in the same phase space
region for some time.
If only a time series
is available, the phase space can be reconstructed by using a time delay embedding (see Takens' theorem
):

where is the time series,
  the embedding dimension and
  the time delay.
The RQA quantifies the small-scale structures of recurrence plots, which present the number and duration of the recurrences of a dynamical system. The measures introduced for the RQA were developed heuristically between 1992 and 2002 (Zbilut & Webber 1992; Webber & Zbilut 1994; Marwan et al. 2002). They are actually measures of complexity. The main advantage of the recurrence quantification analysis is that it can provide useful information even for short and non-stationary data, where other methods fail.
RQA can be applied to almost every kind of data. It is widely used in physiology
, but was also successfully applied on problems from engineering
, chemistry
, Earth sciences etc.

The recurrence rate corresponds with the probability that a specific state will recur. It is almost equal with the definition of the correlation sum
, where the LOI is excluded from the computation.
The next measure is the percentage of recurrence points which diagonal lines in the recurrence plot of minimal length :
:

where is the frequency distribution
of the lengths of the diagonal lines. This measures is called determinism and is related with the predictability
of the dynamical system
, because white noise
has a recurrence plot with almost only single dots and very few diagonal lines, whereas a deterministic process has a recurrence plot with very few single dots but many long diagonal lines.
The amount of recurrence points which form vertical lines can be quantified in the same way:

where is the frequency distribution of the lengths
  of the vertical lines, which have at least a length of
  . This measure is called laminarity and related with the amount of laminar phases in the system (intermittency
).
The lengths of the diagonal and vertical lines can be measured as well. The averaged diagonal line length

is related with the predictability time of the dynamical system
and the trapping time, measuring the average length
of the vertical lines,

is related with the laminarity time of the dynamical system, i.e. how long the system remains in a specific state.
Because the length of the diagonal lines is related on the time how long segments of the phase space
trajectory run parallel, i.e. on the divergence
behaviour of the trajectories, it was sometimes stated that the reciprocal
of the maximal length of the diagonal lines (without LOI) would be an estimator for the positive maximal Lyapunov exponent
of the dynamical system. Therefore, the maximal diagonal line length or the divergence

are also measures of the RQA. However, the relationship between these measures with the positive maximal Lyapunov exponent is not as easy as stated, but even more complex (to calculate the Lyapunov exponent from an RP, the whole frequency distribution of the diagonal lines has to be considered). The divergence can have the trend of the positive maximal Lyapunov exponent, but not more. Moreover, also RPs of white noise processes can have a really long diagonal line, although very seldom, just by a finite probability. It is obvious that therefore the divergence cannot reflect the maximal Lyapunov exponent.
The probability
 that a diagonal line has exactly length
  can be estimated from the frequency distribution
  with
with  . The Shannon entropy of this probability,

reflects the complexity of the deterministic structure in the system. However, this entropy depends sensitively on the bin number and, thus, may differ for different realisations of the same process, as well as for different data preparations.
The last measure of the RQA quantifies the thinning-out of the recurrence plot. The trend is the regression coefficient of a linear relationship between the density of recurrence points in a line parallel to the LOI and its distance to the LOI. More exactly, let us consider the recurrence rate in a diagonal line parallel to LOI of distance k (diagonal-wise recurrence rate):

then the trend is defined by

with as the average value and
  . This latter relation should ensure to avoid the edge effects of too low recurrence point densities in the edges of the recurrence plot. The measure trend provides information about the stationarity of the system.
Similar to the diagonal-wise defined recurrence rate, the other measures based on the diagonal lines (DET, L, ENTR) can be defined diagonal-wise. These definitions are useful to study interrelations or synchronisation between different systems (using recurrence plot
s or cross recurrence plots).
Data analysis
Analysis of data is a process of inspecting, cleaning, transforming, and modeling data with the goal of highlighting useful information, suggesting conclusions, and supporting decision making...
(cf. chaos theory
Chaos theory
Chaos theory is a field of study in mathematics, with applications in several disciplines including physics, economics, biology, and philosophy. Chaos theory studies the behavior of dynamical systems that are highly sensitive to initial conditions, an effect which is popularly referred to as the...
) for the investigation of dynamical systems. It quantifies the number and duration of recurrences of a dynamical system presented by its phase space
Phase space
In mathematics and physics, a phase space, introduced by Willard Gibbs in 1901, is a space in which all possible states of a system are represented, with each possible state of the system corresponding to one unique point in the phase space...
trajectory.
Background
The recurrence quantification analysis was developed in order to quantify differently appearing recurrence plotRecurrence plot
In descriptive statistics and chaos theory, a recurrence plot is a plot showing, for a given moment in time, the times at which a phase space trajectory visits roughly the same area in the phase space...
s (RPs) based on the small-scale structures therein. Recurrence plot
Recurrence plot
In descriptive statistics and chaos theory, a recurrence plot is a plot showing, for a given moment in time, the times at which a phase space trajectory visits roughly the same area in the phase space...
s are tools which visualise the recurrence behaviour of the phase space
Phase space
In mathematics and physics, a phase space, introduced by Willard Gibbs in 1901, is a space in which all possible states of a system are represented, with each possible state of the system corresponding to one unique point in the phase space...
trajectory of dynamical systems. They mostly contain single dots and lines which are parallel to the mean diagonal (line of identity, LOI) or which are vertical/horizontal. Lines parallel to the LOI are referred to as diagonal lines and the vertical structures as vertical lines. Because an RP is usually symmetric, horizontal and vertical lines correspond to each other, and, hence, only vertical lines are considered. The lines correspond to a typical behaviour of the phase space trajectory: whereas the diagonal lines represent such segments of the phase space trajectory which run parallel for some time, the vertical lines represent segments which remain in the same phase space
Phase space
In mathematics and physics, a phase space, introduced by Willard Gibbs in 1901, is a space in which all possible states of a system are represented, with each possible state of the system corresponding to one unique point in the phase space...
region for some time.
If only a time series
Time series
In statistics, signal processing, econometrics and mathematical finance, a time series is a sequence of data points, measured typically at successive times spaced at uniform time intervals. Examples of time series are the daily closing value of the Dow Jones index or the annual flow volume of the...
is available, the phase space can be reconstructed by using a time delay embedding (see Takens' theorem
Takens' theorem
In mathematics, a delay embedding theorem gives the conditions under which a chaotic dynamical system can be reconstructed from a sequence of observations of the state of a dynamical system...
):
where
is the time series, the embedding dimension and the time delay.The RQA quantifies the small-scale structures of recurrence plots, which present the number and duration of the recurrences of a dynamical system. The measures introduced for the RQA were developed heuristically between 1992 and 2002 (Zbilut & Webber 1992; Webber & Zbilut 1994; Marwan et al. 2002). They are actually measures of complexity. The main advantage of the recurrence quantification analysis is that it can provide useful information even for short and non-stationary data, where other methods fail.
RQA can be applied to almost every kind of data. It is widely used in physiology
Physiology
Physiology is the science of the function of living systems. This includes how organisms, organ systems, organs, cells, and bio-molecules carry out the chemical or physical functions that exist in a living system. The highest honor awarded in physiology is the Nobel Prize in Physiology or...
, but was also successfully applied on problems from engineering
Engineering
Engineering is the discipline, art, skill and profession of acquiring and applying scientific, mathematical, economic, social, and practical knowledge, in order to design and build structures, machines, devices, systems, materials and processes that safely realize improvements to the lives of...
, chemistry
Chemistry
Chemistry is the science of matter, especially its chemical reactions, but also its composition, structure and properties. Chemistry is concerned with atoms and their interactions with other atoms, and particularly with the properties of chemical bonds....
, Earth sciences etc.
RQA measures
The simplest measure is the recurrence rate, which is the density of recurrence points in a recurrence plot:The recurrence rate corresponds with the probability that a specific state will recur. It is almost equal with the definition of the correlation sum
Correlation sum
In chaos theory, the correlation sum is the estimator of the correlation integral, which reflects the mean probability that the states at two different times are close:...
, where the LOI is excluded from the computation.
The next measure is the percentage of recurrence points which diagonal lines in the recurrence plot of minimal length
:where
is the frequency distributionFrequency distribution
In statistics, a frequency distribution is an arrangement of the values that one or more variables take in a sample. Each entry in the table contains the frequency or count of the occurrences of values within a particular group or interval, and in this way, the table summarizes the distribution of...
of the lengths
of the diagonal lines. This measures is called determinism and is related with the predictabilityPredictability
Predictability is the degree to which a correct prediction or forecast of a system's state can be made either qualitatively or quantitatively.-Predictability and Causality:...
of the dynamical system
Dynamical system
A dynamical system is a concept in mathematics where a fixed rule describes the time dependence of a point in a geometrical space. Examples include the mathematical models that describe the swinging of a clock pendulum, the flow of water in a pipe, and the number of fish each springtime in a...
, because white noise
White noise
White noise is a random signal with a flat power spectral density. In other words, the signal contains equal power within a fixed bandwidth at any center frequency...
has a recurrence plot with almost only single dots and very few diagonal lines, whereas a deterministic process has a recurrence plot with very few single dots but many long diagonal lines.
The amount of recurrence points which form vertical lines can be quantified in the same way:
where
is the frequency distribution of the lengths of the vertical lines, which have at least a length of . This measure is called laminarity and related with the amount of laminar phases in the system (intermittencyIntermittency
In dynamical systems, intermittency is the irregular alternation of phases of apparently periodic and chaotic dynamics , or different forms of chaotic dynamics ....
).
The lengths of the diagonal and vertical lines can be measured as well. The averaged diagonal line length
is related with the predictability time of the dynamical system
and the trapping time, measuring the average length
of the vertical lines,
is related with the laminarity time of the dynamical system, i.e. how long the system remains in a specific state.
Because the length of the diagonal lines is related on the time how long segments of the phase space
Phase space
In mathematics and physics, a phase space, introduced by Willard Gibbs in 1901, is a space in which all possible states of a system are represented, with each possible state of the system corresponding to one unique point in the phase space...
trajectory run parallel, i.e. on the divergence
Divergence
In vector calculus, divergence is a vector operator that measures the magnitude of a vector field's source or sink at a given point, in terms of a signed scalar. More technically, the divergence represents the volume density of the outward flux of a vector field from an infinitesimal volume around...
behaviour of the trajectories, it was sometimes stated that the reciprocal
Multiplicative inverse
In mathematics, a multiplicative inverse or reciprocal for a number x, denoted by 1/x or x−1, is a number which when multiplied by x yields the multiplicative identity, 1. The multiplicative inverse of a fraction a/b is b/a. For the multiplicative inverse of a real number, divide 1 by the...
of the maximal length of the diagonal lines (without LOI) would be an estimator for the positive maximal Lyapunov exponent
Lyapunov exponent
In mathematics the Lyapunov exponent or Lyapunov characteristic exponent of a dynamical system is a quantity that characterizes the rate of separation of infinitesimally close trajectories...
of the dynamical system. Therefore, the maximal diagonal line length
or the divergenceare also measures of the RQA. However, the relationship between these measures with the positive maximal Lyapunov exponent is not as easy as stated, but even more complex (to calculate the Lyapunov exponent from an RP, the whole frequency distribution of the diagonal lines has to be considered). The divergence can have the trend of the positive maximal Lyapunov exponent, but not more. Moreover, also RPs of white noise processes can have a really long diagonal line, although very seldom, just by a finite probability. It is obvious that therefore the divergence cannot reflect the maximal Lyapunov exponent.
The probability
Probability
Probability is ordinarily used to describe an attitude of mind towards some proposition of whose truth we arenot certain. The proposition of interest is usually of the form "Will a specific event occur?" The attitude of mind is of the form "How certain are we that the event will occur?" The...
that a diagonal line has exactly length can be estimated from the frequency distribution with . The Shannon entropy of this probability,reflects the complexity of the deterministic structure in the system. However, this entropy depends sensitively on the bin number and, thus, may differ for different realisations of the same process, as well as for different data preparations.
The last measure of the RQA quantifies the thinning-out of the recurrence plot. The trend is the regression coefficient of a linear relationship between the density of recurrence points in a line parallel to the LOI and its distance to the LOI. More exactly, let us consider the recurrence rate in a diagonal line parallel to LOI of distance k (diagonal-wise recurrence rate):
then the trend is defined by
with
as the average value and . This latter relation should ensure to avoid the edge effects of too low recurrence point densities in the edges of the recurrence plot. The measure trend provides information about the stationarity of the system.Similar to the diagonal-wise defined recurrence rate, the other measures based on the diagonal lines (DET, L, ENTR) can be defined diagonal-wise. These definitions are useful to study interrelations or synchronisation between different systems (using recurrence plot
Recurrence plot
In descriptive statistics and chaos theory, a recurrence plot is a plot showing, for a given moment in time, the times at which a phase space trajectory visits roughly the same area in the phase space...
s or cross recurrence plots).
Time-dependent RQA
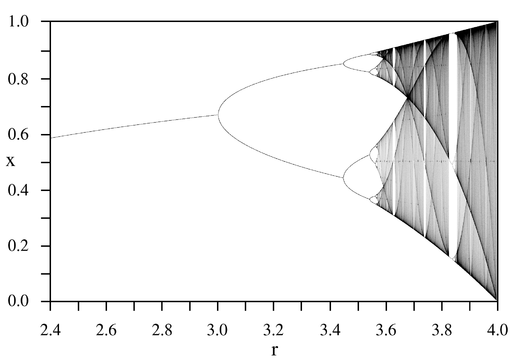
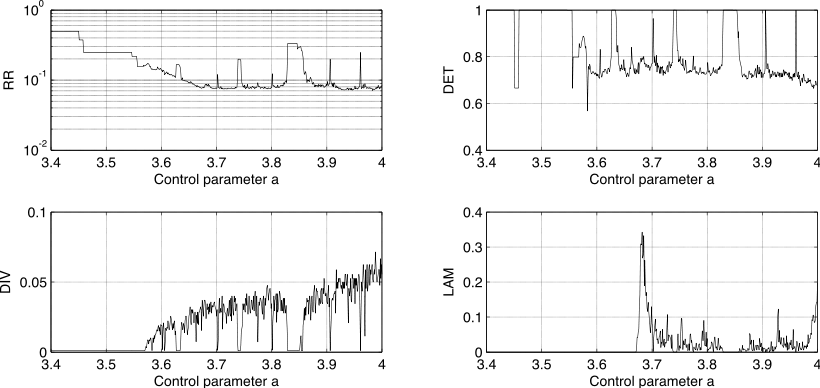
Instead of computing the RQA measures of the entire recurrence plot, they can be computed in small windows moving over the recurrence plot along the LOI. This provides time-dependent RQA measures which are able to detect, e.g., chaos-chaos transitions (Marwan et al. 2002). Note: the choice of the size of the window can strongly influence the measure trend.Example
See also
- Recurrence plotRecurrence plotIn descriptive statistics and chaos theory, a recurrence plot is a plot showing, for a given moment in time, the times at which a phase space trajectory visits roughly the same area in the phase space...
, a powerful visualisation tool of recurrences in dynamical (and other) systems.
External links
- http://www.recurrence-plot.tk/
- http://www.scitopics.com/Recurrence_Quantification_Analysis.html