
Post-World War II baby boom
Encyclopedia
The end of World War II
brought a baby boom
to many countries, especially Western ones. There is some disagreement as to the precise beginning and ending dates of the post-war baby boom, but it is most often agreed to begin in the years immediately after the war, ending more than a decade later; birth rates in the United States started to decline in 1957. In areas that had suffered heavy war damage, displacement of people and post-war economic hardship, such as Poland, the boom began some years later.
In May 1951, Sylvia Porter, a columnist for the New York Post
, used the term "boom" to refer to the phenomenon of increased births in post war America.
.
In 1946, live births in the U.S. surged from 222,721 in January to 339,499 in October. By the end of the 1940s, about 32 million babies had been born, compared with 24 million in the 1930s. In 1954, annual births first topped four million and did not drop below that figure until 1965, when four out of ten Americans were under the age of twenty.
In the years after the war, couples who could not afford families during the Great Depression made up for lost time; the mood was now optimistic. During the war unemployment ended and the economy greatly expanded; afterwards the country experienced vigorous economic growth until the 1970s. The G.I. Bill enabled record numbers of people to finish high school and attend college. This led to an increase in stock of skills and yielded higher incomes to families.
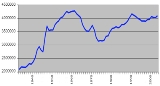
As can be seen by the birth rate chart, the "birth boom" of the post–World War II period is, in a way, as much or more defined by the birth dearths that preceded and followed it, than by any exceptionally high fertility rate. Comparing birth rates from 1946 to 1964 with the rates, say, prior to World War I, the post–World War II rates are much lower, though they are high in comparison to the time periods immediately preceding and following 1946 - 1964.
The exact beginning and end of the baby boom can be debated. In the United States, demographers usually use 1946 to 1964, although the U.S. birthrate began to shoot up in 1941 and to decline after 1957. By 1948, the US population increase was back to the pre-Depression increase rate of about 1.5% per year. According to certain sources, the beginning of the boomer
period could have been as early as January 1944.
Based on US census information:
. This bill encouraged home ownership and investment in higher education through the distribution of loans at low or no interest rates to veterans.
Returning G.I.’s were getting married, starting families, pursuing higher education and buying their first homes. With veteran’s benefits, the twenty-somethings found new homes in planned communities on the outskirts of American cities. This group, whose formative years covered the Great Depression, were a generation hardened by poverty and deprived of the security of a home or job. Now thriving on the American Dream, life was simple, jobs were plentiful and babies were booming.
Many Americans believed that lack of post-war government spending would send the United States back into depression. However, consumer demand fueled economic growth. The baby boom triggered a housing boom, consumption boom and a boom in the labor force. Between 1940 and 1960, the nation’s GDP jumped more than $300,000 million. The middle class grew and the majority of America’s labor force held white-collar jobs. This increase led to urbanization and increased the demand for ownership in cars and other '50s and '60s inventions.
) degree.
in his "Twentieth Century American Population Growth" (2000), explains the growth pattern of American population in the twentieth century by examining the fertility rate fluctuations and the decreasing mortality rate. Easterlin attempts to prove the cause of the Baby Boom and Baby Bust by the “relative income” theory, despite the various other theories that these events have been attributed to. The “relative income” theory suggests that couples choose to have children based on a couple’s ratio of potential earning power and the desire to obtain material objects. This ratio depends on the economic stability of the country and how people are raised to value material objects. The “relative income” theory explains the Baby Boom by suggesting that the late 1940s and the 1950s brought low desires to have material objects, because of the Great Depression and World War II, as well as plentiful job opportunities (being a post-war period). These two factors gave rise to a high relative income, which encouraged high fertility. Following this period, the next generation had a greater desire for material objects, however an economic slowdown in the United States made jobs harder to acquire. This resulted in lower fertility rates causing the Baby Bust.>
, the baby boom is usually defined as occurring from 1947 to 1966, the years that more than 400,000 babies were born. Canadian soldiers were repatriated later than American servicemen, and Canada's birthrate did not start to rise until 1947. Most Canadian demographers prefer to use the later date of 1966 as the boom's end year in that country. The later end than the US (baby-boom generation: babies born from 1946 to 1964; see preceding paragraphs) is ascribed to a later adoption of birth control pills. In Quebec the baby boom years, 1945–60, ended an era of stagnant growth.

In some of these examples, an "echo boom" followed some time after as the offspring of the initial boom gave rise to a second increase, with a baby "bust" in between. The birth years of the baby boom as noted being both short and long lived, creates what many believe to be a myth to the notion of defining baby boomers as one "generation", as a unified concept is clearly not possible. Indeed, multiple generations may be present in a single country such as Ireland where the boom lasted 36 years. This overlapping effect of generations is not illuminated when considering crude fertility rates. The only common ground for the collective boom is the same approximate starting year. This example can be applied to each state in the United States on an individual basis. The states with a census in place in 1946 saw fertility rates drop to pre-war levels throughout the 1960s, with the average being in 1964.
World War II
World War II, or the Second World War , was a global conflict lasting from 1939 to 1945, involving most of the world's nations—including all of the great powers—eventually forming two opposing military alliances: the Allies and the Axis...
brought a baby boom
Baby boom
A baby boom is any period marked by a greatly increased birth rate. This demographic phenomenon is usually ascribed within certain geographical bounds and when the number of annual births exceeds 2 per 100 women...
to many countries, especially Western ones. There is some disagreement as to the precise beginning and ending dates of the post-war baby boom, but it is most often agreed to begin in the years immediately after the war, ending more than a decade later; birth rates in the United States started to decline in 1957. In areas that had suffered heavy war damage, displacement of people and post-war economic hardship, such as Poland, the boom began some years later.
In May 1951, Sylvia Porter, a columnist for the New York Post
New York Post
The New York Post is the 13th-oldest newspaper published in the United States and is generally acknowledged as the oldest to have been published continuously as a daily, although – as is the case with most other papers – its publication has been periodically interrupted by labor actions...
, used the term "boom" to refer to the phenomenon of increased births in post war America.
In the United States
There are an estimated 77.3 million Americans who were born during this demographic boom in births. Baby Boomers are now late middle age and entering senior years. In the economy, many are now retiring and leaving the labor forceLabor force
In economics, a labor force or labour force is a region's combined civilian workforce, including both the employed and unemployed.Normally, the labor force of a country consists of everyone of working age In economics, a labor force or labour force is a region's combined civilian workforce,...
.
In 1946, live births in the U.S. surged from 222,721 in January to 339,499 in October. By the end of the 1940s, about 32 million babies had been born, compared with 24 million in the 1930s. In 1954, annual births first topped four million and did not drop below that figure until 1965, when four out of ten Americans were under the age of twenty.
In the years after the war, couples who could not afford families during the Great Depression made up for lost time; the mood was now optimistic. During the war unemployment ended and the economy greatly expanded; afterwards the country experienced vigorous economic growth until the 1970s. The G.I. Bill enabled record numbers of people to finish high school and attend college. This led to an increase in stock of skills and yielded higher incomes to families.
Definition of the boom years
It is important to distinguish between the demographic boom in births, and the actual generations born during that period. This article deals with the demographic birth boom, not generations.As can be seen by the birth rate chart, the "birth boom" of the post–World War II period is, in a way, as much or more defined by the birth dearths that preceded and followed it, than by any exceptionally high fertility rate. Comparing birth rates from 1946 to 1964 with the rates, say, prior to World War I, the post–World War II rates are much lower, though they are high in comparison to the time periods immediately preceding and following 1946 - 1964.
The exact beginning and end of the baby boom can be debated. In the United States, demographers usually use 1946 to 1964, although the U.S. birthrate began to shoot up in 1941 and to decline after 1957. By 1948, the US population increase was back to the pre-Depression increase rate of about 1.5% per year. According to certain sources, the beginning of the boomer
Baby boomer
A baby boomer is a person who was born during the demographic Post-World War II baby boom and who grew up during the period between 1946 and 1964. The term "baby boomer" is sometimes used in a cultural context. Therefore, it is impossible to achieve broad consensus of a precise definition, even...
period could have been as early as January 1944.
Based on US census information:
- US Involvement in World War II (+ 5 post boomer years)
Year US resident population
(thousands)Net change
(thousands)Percent change 1941 133,121 1,161 0.88 1942 133,920 799 0.60 1943 134,245 325 0.24 1944 132,885 −1,360 −1.01 1945 132,481 −404 −0.30 1946 140,054 7,573 5.72 1947 143,446 3,392 2.42 1948 146,093 2,647 1.85 1949 148,665 2,572 1.76 1950 151,868 3,203 2.15 10 year average - 1,991 1.43
Historical and Social background
When the war ended in 1945, millions of veterans returned home and were forced to integrate. To help the integration process, Congress passed the G.I. Bill of RightsG.I. Bill of Rights
The Servicemen's Readjustment Act of 1944 , known informally as the G.I. Bill, was an omnibus law that provided college or vocational education for returning World War II veterans as well as one year of unemployment compensation...
. This bill encouraged home ownership and investment in higher education through the distribution of loans at low or no interest rates to veterans.
Returning G.I.’s were getting married, starting families, pursuing higher education and buying their first homes. With veteran’s benefits, the twenty-somethings found new homes in planned communities on the outskirts of American cities. This group, whose formative years covered the Great Depression, were a generation hardened by poverty and deprived of the security of a home or job. Now thriving on the American Dream, life was simple, jobs were plentiful and babies were booming.
Many Americans believed that lack of post-war government spending would send the United States back into depression. However, consumer demand fueled economic growth. The baby boom triggered a housing boom, consumption boom and a boom in the labor force. Between 1940 and 1960, the nation’s GDP jumped more than $300,000 million. The middle class grew and the majority of America’s labor force held white-collar jobs. This increase led to urbanization and increased the demand for ownership in cars and other '50s and '60s inventions.
Marriage rates
Marriage rate rose sharply in the 1940s and reached all-time highs. After World War II, Americans began to marry at a younger age: the average age of a person at their first marriage dropped to 22.5 years for males and 20.1 for females, down from 24.3 for males and 21.5 for females in 1940. Getting married immediately after high school was becoming commonplace and women were increasingly under tremendous pressure to marry by the age of 20. The stereotype developed that women were going to college to earn their M.R.S. (Mrs.Mrs.
Mrs or Mrs. is a honorific used for women, usually for those who are married and who do not instead use another title, such as Dr, Lady, or Dame. In most Commonwealth countries, a full stop is not used with the title...
) degree.
Family size
Family size increased sharply throughout the baby boom: the average woman bore 3.09 children in 1950 which increased to 3.65 children per family in 1960; the peak was in 1957, when the figure stood at 3.77. Most couples became pregnant with their first child within 7 months of their wedding; between 1940 to 1960, the number of families with three children doubled and the number of families having a fourth child quadrupled.Easterlin Models
Economist and demographer Richard EasterlinRichard Easterlin
Richard A. Easterlin is University Professor and Professor of Economics at the University of Southern California. He is a member of the National Academy of Sciences and the American Academy of Arts and Sciences...
in his "Twentieth Century American Population Growth" (2000), explains the growth pattern of American population in the twentieth century by examining the fertility rate fluctuations and the decreasing mortality rate. Easterlin attempts to prove the cause of the Baby Boom and Baby Bust by the “relative income” theory, despite the various other theories that these events have been attributed to. The “relative income” theory suggests that couples choose to have children based on a couple’s ratio of potential earning power and the desire to obtain material objects. This ratio depends on the economic stability of the country and how people are raised to value material objects. The “relative income” theory explains the Baby Boom by suggesting that the late 1940s and the 1950s brought low desires to have material objects, because of the Great Depression and World War II, as well as plentiful job opportunities (being a post-war period). These two factors gave rise to a high relative income, which encouraged high fertility. Following this period, the next generation had a greater desire for material objects, however an economic slowdown in the United States made jobs harder to acquire. This resulted in lower fertility rates causing the Baby Bust.>
In Canada
In CanadaHistory of Canada
The history of Canada covers the period from the arrival of Paleo-Indians thousands of years ago to the present day. Canada has been inhabited for millennia by distinctive groups of Aboriginal peoples, among whom evolved trade networks, spiritual beliefs, and social hierarchies...
, the baby boom is usually defined as occurring from 1947 to 1966, the years that more than 400,000 babies were born. Canadian soldiers were repatriated later than American servicemen, and Canada's birthrate did not start to rise until 1947. Most Canadian demographers prefer to use the later date of 1966 as the boom's end year in that country. The later end than the US (baby-boom generation: babies born from 1946 to 1964; see preceding paragraphs) is ascribed to a later adoption of birth control pills. In Quebec the baby boom years, 1945–60, ended an era of stagnant growth.
In the United Kingdom
The United Kingdom experienced a second baby boom during the 1960s, with a peak in births in 1964 and a third, smaller boom peaking in 1990. The two peaks can clearly be seen in the UK population pyramids.European and South-Pacific trends
Many European countries, Australia and New Zealand also experienced a baby boom. In some cases the total fertility rate almost doubled. The American birth model, conceived by demographer Frank Notestein, was punctuated by an end to the upsurge in births and a return to pre-war levels. In many European countries the first year of the Post World War II baby boom was the year 1946, but in Germany the first year was the year 1955 in Finland the largest birth rate was in August and September 1945. Prior to World War II, fertility rates in Europe and America were on a general decline due to improved nutrition and medicine, and a surge in births were previously not experienced at such a large scale. Based on this model, baby boom years for other countries regarded for having a baby boom are as follows:- France 1946–1974
- United Kingdom 1946–1974
- Finland 1945–1950
- Germany 1955-1967
- Sweden 1946–1952
- Denmark 1946–1950
- Netherlands 1946–1972
- Ireland 1946–1982
- Hungary 1946-1957
- Iceland 1946–1969
- New Zealand 1946–1961
- Australia 1946–1961
In some of these examples, an "echo boom" followed some time after as the offspring of the initial boom gave rise to a second increase, with a baby "bust" in between. The birth years of the baby boom as noted being both short and long lived, creates what many believe to be a myth to the notion of defining baby boomers as one "generation", as a unified concept is clearly not possible. Indeed, multiple generations may be present in a single country such as Ireland where the boom lasted 36 years. This overlapping effect of generations is not illuminated when considering crude fertility rates. The only common ground for the collective boom is the same approximate starting year. This example can be applied to each state in the United States on an individual basis. The states with a census in place in 1946 saw fertility rates drop to pre-war levels throughout the 1960s, with the average being in 1964.