
Phase diagram
Encyclopedia
A phase diagram in physical chemistry
, engineering
, mineralogy
, and materials science
is a type of chart
used to show conditions at which thermodynamically distinct phases
can occur at equilibrium
. In mathematics
and physics
, "phase diagram" is used with a different meaning: a synonym for a phase space
.
Triple point
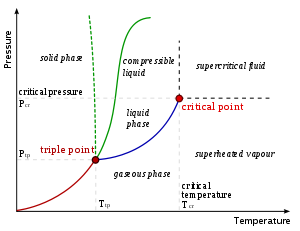
s are points on phase diagrams where lines of equilibrium intersect. Triple points mark conditions at which three different phases can coexist. For example, the water phase diagram has a triple point corresponding to the single temperature and pressure at which solid, liquid, and gaseous water can coexist in a stable equilibrium.
The solidus
is the temperature below which the substance is stable in the solid state. The liquidus is the temperature above which the substance is stable in a liquid state. There may be a gap between the solidus and liquidus; within the gap, the substance consists of a mixture of crystals and liquid (like a "slurry").
correspond to the pressure
and temperature
. The phase diagram shows, in pressure-temperature space, the lines of equilibrium or phase boundaries between the three phases of solid
, liquid
, and gas
.
 The curves on the phase diagram show the points where the free energy (and other derived properties) becomes non-analytic: their derivatives with respect to the coordinates (temperature and pressure in this example) change discontinuously (abruptly). For example, the heat capacity of a container filled with ice will change abruptly as the container is heated past the melting point. The open spaces, where the free energy
is analytic
, correspond to single phase regions. Single phase regions are separated by lines of non-analytical, where phase transition
s occur, which are called phase boundaries.
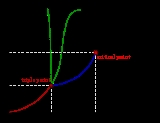
In the diagram on the left, the phase boundary between liquid and gas does not continue indefinitely. Instead, it terminates at a point on the phase diagram called the critical point
. This reflects the fact that, at extremely high temperatures and pressures, the liquid and gaseous phases become indistinguishable, in what is known as a supercritical fluid
. In water, the critical point occurs at around Tc = 647.096 kelvins (35.9 °R), pc = 22.064 MPa (3,200.1 psi) and ρc = 356 kg/m³.
The existence of the liquid-gas critical point reveals a slight ambiguity in labelling the single phase regions. When going from the liquid to the gaseous phase, one usually crosses the phase boundary, but it is possible to choose a path that never crosses the boundary by going to the right of the critical point. Thus, the liquid and gaseous phases can blend continuously into each other. The solid-liquid phase boundary can only end in a critical point if the solid and liquid phases have the same symmetry group
.
The solid-liquid phase boundary in the phase diagram of most substances has a positive slope
; the greater the pressure on a given substance, the closer together the molecules of the substance are brought to each other, which increases the effect of the substance's intermolecular forces. Thus, the substance requires a higher temperature for its molecules to have enough energy to break out the fixed pattern of the solid phase and enter the liquid phase. A similar concept applies to liquid-gas phase changes. Water, because of its particular properties, is one of the several exceptions to the rule.
Other thermodynamic properties
In addition to just temperature or pressure, other thermodynamic properties may be graphed in phase diagrams. Examples of such thermodynamic properties include specific volume
, specific enthalpy, or specific entropy
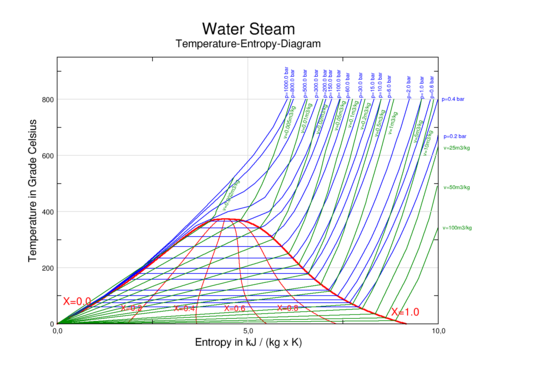
. For example, single-component graphs of Temperature vs. specific entropy (T vs. s) for water/steam
or for a refrigerant
are commonly used to illustrate thermodynamic cycle
s such as a Carnot cycle
, Rankine cycle
, or vapor-compression refrigeration
cycle.
In a two-dimensional graph
, two of the thermodynamic quantities may be shown on the horizontal and vertical axes. Additional thermodymic quantities may each be illustrated in increments as a series of lines - curved, straight, or a combination of curved and straight. Each of these iso-lines represents the thermodynamic quantity at a certain constant value.
of the 3D P-v-T graph showing pressure and temperature as the vertical and horizontal axes effectively collapses the 3D plot into a 2D pressure-temperature diagram. When this is done, the solid-vapor, solid-liquid, and liquid-vapor surfaces collapse into three corresponding curved lines meeting at the triple point, which is the collapsed orthographic projection of the triple line.
becomes an important variable. Phase diagrams with more than two dimensions can be constructed that show the effect of more than two variables on the phase of a substance. Phase diagrams can use other variables in addition to or in place of temperature, pressure and composition, for example the strength of an applied electrical or magnetic field and they can also involve substances that take on more than just three states of matter.
One type of phase diagram plots temperature against the relative concentrations of two substances in a binary mixture
called a binary phase diagram, as shown at right. Such a mixture can be either a solid solution
, eutectic
or peritectic, among others. These two types of mixtures result in very different graphs.
Another type of binary phase diagram is a boiling point diagram for a mixture of two components, i. e. chemical compound
s.
For two particular volatile
components at a certain pressure such as atmospheric pressure
, a boiling point diagram shows what vapor
(gas) compositions are in equilibrium
with given liquid compositions depending on temperature. In a typical binary boiling point diagram, temperature is plotted on a vertical axis and mixture composition on a horizontal axis.
A simple example diagram with hypothetical components 1 and 2 in a non-azeotropic
mixture is shown at right. The fact that there are two separate curved lines joining the boiling points of the pure components means that the vapor composition is usually not the same as the liquid composition the vapor is in equilibrium with. See Vapor-Liquid Equilibrium for more information.
In addition to the above mentioned types of phase diagrams, there are thousands of other possible combinations. Some of the major features of phase diagrams include congruent points, where a solid phase transforms directly into a liquid. There is also the peritectoid, a point where two solid phases combine into one solid phase during cooling. The inverse of this, when one solid phase transforms into two solid phases during heating, is called the eutectoid.
A complex phase diagram of great technological importance is that of the iron
-carbon
system for less than 7% carbon (see steel
).
The x-axis of such a diagram represents the concentration variable of the mixture. As the mixtures are typically far from dilute and their density as a function of temperature is usually unknown, the preferred concentration measure is mole fraction. A volume based measure like molarity would be unadvisable.
and polyamorphic
substances have multiple crystal
or amorphous phases, which can be graphed in a similar fashion to solid, liquid, and gas phases.
s. Attention has been directed to mesophases because they enable display device
s and have become commercially important through the so-called liquid crystal
technology. Phase diagrams are used to describe the occurrence of mesophases.
Physical chemistry
Physical chemistry is the study of macroscopic, atomic, subatomic, and particulate phenomena in chemical systems in terms of physical laws and concepts...
, engineering
Engineering
Engineering is the discipline, art, skill and profession of acquiring and applying scientific, mathematical, economic, social, and practical knowledge, in order to design and build structures, machines, devices, systems, materials and processes that safely realize improvements to the lives of...
, mineralogy
Mineralogy
Mineralogy is the study of chemistry, crystal structure, and physical properties of minerals. Specific studies within mineralogy include the processes of mineral origin and formation, classification of minerals, their geographical distribution, as well as their utilization.-History:Early writing...
, and materials science
Materials science
Materials science is an interdisciplinary field applying the properties of matter to various areas of science and engineering. This scientific field investigates the relationship between the structure of materials at atomic or molecular scales and their macroscopic properties. It incorporates...
is a type of chart
Chart
A chart is a graphical representation of data, in which "the data is represented by symbols, such as bars in a bar chart, lines in a line chart, or slices in a pie chart"...
used to show conditions at which thermodynamically distinct phases
Phase (matter)
In the physical sciences, a phase is a region of space , throughout which all physical properties of a material are essentially uniform. Examples of physical properties include density, index of refraction, and chemical composition...
can occur at equilibrium
Thermodynamic equilibrium
In thermodynamics, a thermodynamic system is said to be in thermodynamic equilibrium when it is in thermal equilibrium, mechanical equilibrium, radiative equilibrium, and chemical equilibrium. The word equilibrium means a state of balance...
. In mathematics
Mathematics
Mathematics is the study of quantity, space, structure, and change. Mathematicians seek out patterns and formulate new conjectures. Mathematicians resolve the truth or falsity of conjectures by mathematical proofs, which are arguments sufficient to convince other mathematicians of their validity...
and physics
Physics
Physics is a natural science that involves the study of matter and its motion through spacetime, along with related concepts such as energy and force. More broadly, it is the general analysis of nature, conducted in order to understand how the universe behaves.Physics is one of the oldest academic...
, "phase diagram" is used with a different meaning: a synonym for a phase space
Phase space
In mathematics and physics, a phase space, introduced by Willard Gibbs in 1901, is a space in which all possible states of a system are represented, with each possible state of the system corresponding to one unique point in the phase space...
.
Overview
Common components of a phase diagram are lines of equilibrium or phase boundaries, which refer to lines that mark conditions under which multiple phases can coexist at equilibrium. Phase transitions occur along lines of equilibrium.Triple point
Triple point
In thermodynamics, the triple point of a substance is the temperature and pressure at which the three phases of that substance coexist in thermodynamic equilibrium...
s are points on phase diagrams where lines of equilibrium intersect. Triple points mark conditions at which three different phases can coexist. For example, the water phase diagram has a triple point corresponding to the single temperature and pressure at which solid, liquid, and gaseous water can coexist in a stable equilibrium.
The solidus
Solidus (chemistry)
In chemistry, materials science, and physics, the solidus is the locus of temperatures below which a given substance is completely solid...
is the temperature below which the substance is stable in the solid state. The liquidus is the temperature above which the substance is stable in a liquid state. There may be a gap between the solidus and liquidus; within the gap, the substance consists of a mixture of crystals and liquid (like a "slurry").
2D phase diagrams
The simplest phase diagrams are pressure-temperature diagrams of a single simple substance, such as water. The axesCartesian coordinate system
A Cartesian coordinate system specifies each point uniquely in a plane by a pair of numerical coordinates, which are the signed distances from the point to two fixed perpendicular directed lines, measured in the same unit of length...
correspond to the pressure
Pressure
Pressure is the force per unit area applied in a direction perpendicular to the surface of an object. Gauge pressure is the pressure relative to the local atmospheric or ambient pressure.- Definition :...
and temperature
Temperature
Temperature is a physical property of matter that quantitatively expresses the common notions of hot and cold. Objects of low temperature are cold, while various degrees of higher temperatures are referred to as warm or hot...
. The phase diagram shows, in pressure-temperature space, the lines of equilibrium or phase boundaries between the three phases of solid
Solid
Solid is one of the three classical states of matter . It is characterized by structural rigidity and resistance to changes of shape or volume. Unlike a liquid, a solid object does not flow to take on the shape of its container, nor does it expand to fill the entire volume available to it like a...
, liquid
Liquid
Liquid is one of the three classical states of matter . Like a gas, a liquid is able to flow and take the shape of a container. Some liquids resist compression, while others can be compressed. Unlike a gas, a liquid does not disperse to fill every space of a container, and maintains a fairly...
, and gas
Gas
Gas is one of the three classical states of matter . Near absolute zero, a substance exists as a solid. As heat is added to this substance it melts into a liquid at its melting point , boils into a gas at its boiling point, and if heated high enough would enter a plasma state in which the electrons...
.
Thermodynamic free energy
The thermodynamic free energy is the amount of work that a thermodynamic system can perform. The concept is useful in the thermodynamics of chemical or thermal processes in engineering and science. The free energy is the internal energy of a system less the amount of energy that cannot be used to...
is analytic
Analytic function
In mathematics, an analytic function is a function that is locally given by a convergent power series. There exist both real analytic functions and complex analytic functions, categories that are similar in some ways, but different in others...
, correspond to single phase regions. Single phase regions are separated by lines of non-analytical, where phase transition
Phase transition
A phase transition is the transformation of a thermodynamic system from one phase or state of matter to another.A phase of a thermodynamic system and the states of matter have uniform physical properties....
s occur, which are called phase boundaries.
In the diagram on the left, the phase boundary between liquid and gas does not continue indefinitely. Instead, it terminates at a point on the phase diagram called the critical point
Critical point (thermodynamics)
In physical chemistry, thermodynamics, chemistry and condensed matter physics, a critical point, also called a critical state, specifies the conditions at which a phase boundary ceases to exist...
. This reflects the fact that, at extremely high temperatures and pressures, the liquid and gaseous phases become indistinguishable, in what is known as a supercritical fluid
Supercritical fluid
A supercritical fluid is any substance at a temperature and pressure above its critical point, where distinct liquid and gas phases do not exist. It can effuse through solids like a gas, and dissolve materials like a liquid...
. In water, the critical point occurs at around Tc = 647.096 kelvins (35.9 °R), pc = 22.064 MPa (3,200.1 psi) and ρc = 356 kg/m³.
The existence of the liquid-gas critical point reveals a slight ambiguity in labelling the single phase regions. When going from the liquid to the gaseous phase, one usually crosses the phase boundary, but it is possible to choose a path that never crosses the boundary by going to the right of the critical point. Thus, the liquid and gaseous phases can blend continuously into each other. The solid-liquid phase boundary can only end in a critical point if the solid and liquid phases have the same symmetry group
Symmetry group
The symmetry group of an object is the group of all isometries under which it is invariant with composition as the operation...
.
The solid-liquid phase boundary in the phase diagram of most substances has a positive slope
Slope
In mathematics, the slope or gradient of a line describes its steepness, incline, or grade. A higher slope value indicates a steeper incline....
; the greater the pressure on a given substance, the closer together the molecules of the substance are brought to each other, which increases the effect of the substance's intermolecular forces. Thus, the substance requires a higher temperature for its molecules to have enough energy to break out the fixed pattern of the solid phase and enter the liquid phase. A similar concept applies to liquid-gas phase changes. Water, because of its particular properties, is one of the several exceptions to the rule.
Other thermodynamic properties
In addition to just temperature or pressure, other thermodynamic properties may be graphed in phase diagrams. Examples of such thermodynamic properties include specific volume
Specific volume
In thermodynamics, the specific volume of a substance is the ratio of the substance's volume to its mass. It is the reciprocal of density:In thermodynamics, the specific volume of a substance is the ratio of the substance's volume to its mass...
, specific enthalpy, or specific entropy
Entropy
Entropy is a thermodynamic property that can be used to determine the energy available for useful work in a thermodynamic process, such as in energy conversion devices, engines, or machines. Such devices can only be driven by convertible energy, and have a theoretical maximum efficiency when...
. For example, single-component graphs of Temperature vs. specific entropy (T vs. s) for water/steam
Steam
Steam is the technical term for water vapor, the gaseous phase of water, which is formed when water boils. In common language it is often used to refer to the visible mist of water droplets formed as this water vapor condenses in the presence of cooler air...
or for a refrigerant
Refrigerant
A refrigerant is a substance used in a heat cycle usually including, for enhanced efficiency, a reversible phase change from a liquid to a gas. Traditionally, fluorocarbons, especially chlorofluorocarbons, were used as refrigerants, but they are being phased out because of their ozone depletion...
are commonly used to illustrate thermodynamic cycle
Thermodynamic cycle
A thermodynamic cycle consists of a series of thermodynamic processes transferring heat and work, while varying pressure, temperature, and other state variables, eventually returning a system to its initial state...
s such as a Carnot cycle
Carnot cycle
The Carnot cycle is a theoretical thermodynamic cycle proposed by Nicolas Léonard Sadi Carnot in 1824 and expanded by Benoit Paul Émile Clapeyron in the 1830s and 40s. It can be shown that it is the most efficient cycle for converting a given amount of thermal energy into work, or conversely,...
, Rankine cycle
Rankine cycle
The Rankine cycle is a cycle that converts heat into work. The heat is supplied externally to a closed loop, which usually uses water. This cycle generates about 90% of all electric power used throughout the world, including virtually all solar thermal, biomass, coal and nuclear power plants. It is...
, or vapor-compression refrigeration
Vapor-compression refrigeration
Vapor-compression refrigeration is one of the many refrigeration cycles available for use. It has been and is the most widely used method for air-conditioning of large public buildings, offices, private residences, hotels, hospitals, theaters, restaurants and automobiles...
cycle.
In a two-dimensional graph
Two-dimensional graph
[Image:cubicpoly.svg||right|thumb|400 px| Graph of the function f=[Image:cubicpoly.svg||right|thumb|400 px| Graph of the function f=[Image:cubicpoly.svg||right|thumb|400 px| Graph of the function f=...
, two of the thermodynamic quantities may be shown on the horizontal and vertical axes. Additional thermodymic quantities may each be illustrated in increments as a series of lines - curved, straight, or a combination of curved and straight. Each of these iso-lines represents the thermodynamic quantity at a certain constant value.
| enthalpy-entropy (h-s) diagram for steam | pressure-enthalpy (p-h) diagram for steam | temperature-entropy (T-s) diagram for steam |
3D phase diagrams
It is possible to envision three-dimensional (3D) graphs showing three thermodynamic quantities. For example for a single component, a 3D Cartesian coordinate type graph can show temperature (T) on one axis, pressure (P) on a second axis, and specific volume (v) on a third. Such a 3D graph is sometimes called a P-v-T diagram. The equilibrium conditions would be shown as a 3D curved surface with areas for solid, liquid, and vapor phases and areas where solid and liquid, solid and vapor, or liquid and vapor coexist in equilibrium. A line on the surface called a triple line is where solid, liquid and vapor can all coexist in equilibrium. The critical point remains a point on the surface even on a 3D phase diagram. An orthographic projectionOrthographic projection
Orthographic projection is a means of representing a three-dimensional object in two dimensions. It is a form of parallel projection, where all the projection lines are orthogonal to the projection plane, resulting in every plane of the scene appearing in affine transformation on the viewing surface...
of the 3D P-v-T graph showing pressure and temperature as the vertical and horizontal axes effectively collapses the 3D plot into a 2D pressure-temperature diagram. When this is done, the solid-vapor, solid-liquid, and liquid-vapor surfaces collapse into three corresponding curved lines meeting at the triple point, which is the collapsed orthographic projection of the triple line.
Binary phase diagrams
Other much more complex types of phase diagrams can be constructed, particularly when more than one pure component is present. In that case concentrationConcentration
In chemistry, concentration is defined as the abundance of a constituent divided by the total volume of a mixture. Four types can be distinguished: mass concentration, molar concentration, number concentration, and volume concentration...
becomes an important variable. Phase diagrams with more than two dimensions can be constructed that show the effect of more than two variables on the phase of a substance. Phase diagrams can use other variables in addition to or in place of temperature, pressure and composition, for example the strength of an applied electrical or magnetic field and they can also involve substances that take on more than just three states of matter.
One type of phase diagram plots temperature against the relative concentrations of two substances in a binary mixture
Mixture
In chemistry, a mixture is a material system made up by two or more different substances which are mixed together but are not combined chemically...
called a binary phase diagram, as shown at right. Such a mixture can be either a solid solution
Solid solution
A solid solution is a solid-state solution of one or more solutes in a solvent. Such a mixture is considered a solution rather than a compound when the crystal structure of the solvent remains unchanged by addition of the solutes, and when the mixture remains in a single homogeneous phase...
, eutectic
Eutectic point
A eutectic system is a mixture of chemical compounds or elements that has a single chemical composition that solidifies at a lower temperature than any other composition. This composition is known as the eutectic composition and the temperature is known as the eutectic temperature...
or peritectic, among others. These two types of mixtures result in very different graphs.
Another type of binary phase diagram is a boiling point diagram for a mixture of two components, i. e. chemical compound
Chemical compound
A chemical compound is a pure chemical substance consisting of two or more different chemical elements that can be separated into simpler substances by chemical reactions. Chemical compounds have a unique and defined chemical structure; they consist of a fixed ratio of atoms that are held together...
s.
For two particular volatile
Volatility (chemistry)
In chemistry and physics, volatility is the tendency of a substance to vaporize. Volatility is directly related to a substance's vapor pressure. At a given temperature, a substance with higher vapor pressure vaporizes more readily than a substance with a lower vapor pressure.The term is primarily...
components at a certain pressure such as atmospheric pressure
Atmospheric pressure
Atmospheric pressure is the force per unit area exerted into a surface by the weight of air above that surface in the atmosphere of Earth . In most circumstances atmospheric pressure is closely approximated by the hydrostatic pressure caused by the weight of air above the measurement point...
, a boiling point diagram shows what vapor
Vapor
A vapor or vapour is a substance in the gas phase at a temperature lower than its critical point....
(gas) compositions are in equilibrium
Vapor-liquid equilibrium
Vapor–liquid equilibrium is a condition where a liquid and its vapor are in equilibrium with each other, a condition or state where the rate of evaporation equals the rate of condensation on a molecular level such that there is no net vapor-liquid interconversion...
with given liquid compositions depending on temperature. In a typical binary boiling point diagram, temperature is plotted on a vertical axis and mixture composition on a horizontal axis.
A simple example diagram with hypothetical components 1 and 2 in a non-azeotropic
Azeotrope
An azeotrope is a mixture of two or more liquids in such a ratio that its composition cannot be changed by simple distillation. This occurs because, when an azeotrope is boiled, the resulting vapor has the same ratio of constituents as the original mixture....
mixture is shown at right. The fact that there are two separate curved lines joining the boiling points of the pure components means that the vapor composition is usually not the same as the liquid composition the vapor is in equilibrium with. See Vapor-Liquid Equilibrium for more information.
In addition to the above mentioned types of phase diagrams, there are thousands of other possible combinations. Some of the major features of phase diagrams include congruent points, where a solid phase transforms directly into a liquid. There is also the peritectoid, a point where two solid phases combine into one solid phase during cooling. The inverse of this, when one solid phase transforms into two solid phases during heating, is called the eutectoid.
A complex phase diagram of great technological importance is that of the iron
Iron
Iron is a chemical element with the symbol Fe and atomic number 26. It is a metal in the first transition series. It is the most common element forming the planet Earth as a whole, forming much of Earth's outer and inner core. It is the fourth most common element in the Earth's crust...
-carbon
Carbon
Carbon is the chemical element with symbol C and atomic number 6. As a member of group 14 on the periodic table, it is nonmetallic and tetravalent—making four electrons available to form covalent chemical bonds...
system for less than 7% carbon (see steel
Steel
Steel is an alloy that consists mostly of iron and has a carbon content between 0.2% and 2.1% by weight, depending on the grade. Carbon is the most common alloying material for iron, but various other alloying elements are used, such as manganese, chromium, vanadium, and tungsten...
).
The x-axis of such a diagram represents the concentration variable of the mixture. As the mixtures are typically far from dilute and their density as a function of temperature is usually unknown, the preferred concentration measure is mole fraction. A volume based measure like molarity would be unadvisable.
Crystal phase diagrams
PolymorphicPolymorphism (materials science)
Polymorphism in materials science is the ability of a solid material to exist in more than one form or crystal structure. Polymorphism can potentially be found in any crystalline material including polymers, minerals, and metals, and is related to allotropy, which refers to chemical elements...
and polyamorphic
Polyamorphism
Polyamorphism is the ability of a substance to exist in several different amorphous modifications. It is analogous to the polymorphism of crystalline materials. Many amorphous substances can exist with different amorphous characteristics . However, polyamorphism requires two distinct amorphous...
substances have multiple crystal
Crystal
A crystal or crystalline solid is a solid material whose constituent atoms, molecules, or ions are arranged in an orderly repeating pattern extending in all three spatial dimensions. The scientific study of crystals and crystal formation is known as crystallography...
or amorphous phases, which can be graphed in a similar fashion to solid, liquid, and gas phases.
Mesophase diagrams
Some organic materials pass through intermediate states between solid and liquid; these states are called mesophaseMesophase
In physics, a mesophase is a state of matter intermediate between liquid and solid. Gelatin is a common example of a partially-ordered structure in a mesophase...
s. Attention has been directed to mesophases because they enable display device
Display device
A display device is an output device for presentation of information in visual or tactile form...
s and have become commercially important through the so-called liquid crystal
Liquid crystal
Liquid crystals are a state of matter that have properties between those of a conventional liquid and those of a solid crystal. For instance, an LC may flow like a liquid, but its molecules may be oriented in a crystal-like way. There are many different types of LC phases, which can be...
technology. Phase diagrams are used to describe the occurrence of mesophases.
See also
- CALPHAD (method)
- Congruent meltingCongruent meltingCongruent melting occurs during melting of a compound when the composition of the liquid that forms is the same as the composition of the solid. It can be contrasted with incongruent melting....
and incongruent meltingIncongruent meltingIncongruent melting occurs when a substance does not melt uniformly and decomposes into another substance. For example, potassium feldspar decomposes to leucite when it melts. The decomposition is not complete, however... - Gibbs phase rule
- Glass databasesGlass databasesGlass databases are a collection of glass compositions, glass properties, glass models, associated trademark names, patents etc. These data were collected from publications in scientific papers and patents, from personal communication with scientists and engineers, and other relevant...
- Hamiltonian mechanicsHamiltonian mechanicsHamiltonian mechanics is a reformulation of classical mechanics that was introduced in 1833 by Irish mathematician William Rowan Hamilton.It arose from Lagrangian mechanics, a previous reformulation of classical mechanics introduced by Joseph Louis Lagrange in 1788, but can be formulated without...
- Phase separation
- Schreinemaker's analysisSchreinemaker's analysisSchreinemaker's Analysis is the use of Schreinemaker's Rules to create a phase diagram.After applying Schreinemaker's Rules and creating a phase diagram, the resulting geometric figure will be thermodynamically accurate, although the axes will be undetermined...