

Percentile
Encyclopedia
In statistics
, a percentile (or centile) is the value of a variable below which a certain percent
of observations fall. For example, the 20th percentile is the value (or score) below which 20 percent of the observations may be found. The term percentile and the related term percentile rank
are often used in the reporting of scores from norm-referenced test
s.
The 25th percentile is also known as the first quartile
(Q1), the 50th percentile as the median
or second quartile (Q2), and the 75th percentile as the third quartile (Q3).
however all definitions yield similar results when the number of observations is very large.
 ) of N ordered values (arranged from least to greatest) is obtained by first calculating the (ordinal
) rank
rounding the result to the nearest integer, and then taking the value that corresponds to that rank. (Note that the rounded value of n is just the least integer which exceeds .)
.)
For example, by this definition, given the numbers
the rank of the 30th percentile would be
Thus the 30th percentile is the second number in the sorted list, 20.
The 40th percentile would have rank
so the 40th percentile would be the third number (since 2.5 rounds up to 3), or 35.
The 100th percentile is defined to be the largest value. (In this case we do not use the above definition with P=100, because the rank n would be greater than the number N of values in the original list.)
between the two nearest ranks.
In particular, given the N sorted values , we define the percent rank corresponding to the nth value as:
In this way, for example, if the percent rank corresponding to the third value is
The value v of the P-th percentile may now be calculated as follows:
If or
or  , then we take
  or
or  , respectively.
If there is some integer k for which , then we take
  .
.
Otherwise, we find the integer k for which , and take
Using the list of numbers above, the 40th percentile would be found by linearly interpolating between the 30th percentile, 20, and the 50th, 35. Specifically:
This is halfway between 20 and 35, which one would expect since the rank was calculated above as 2.5.
It is readily confirmed that the 50th percentile of any list of values according to this definition of the P-th percentile is just the sample median.
Moreover, when N is even the 25th percentile according to this definition of the P-th percentile is the median of the first values (i.e., the median of the lower half of the data).
Suppose we have positive weights associated, respectively, with our N sorted sample values. Let
the -th partial sum of the weights. Then the formulas above are generalized by taking
and
use the following method, noted as an alternative by NIST
to estimate the value, , of the P-th percentile of an ascending ordered dataset containing N elements with values
  .
.
The rank is calculated:
and then split into its integer component k and decimal component d, such that . Then
  is calculated as:
The primary method recommended by NIST
is similar to that given above, but with the rank calculated as
These two approaches give the rank of the 40th percentile in the above example as, respectively:
and
The values are then interpolated as usual based on these ranks, yielding 29 and 26, respectively, for the 40th percentile.
bill "burstable" internet bandwidth
, the 95th or 98th percentile usually cuts off the top 5% or 2% of bandwidth peaks in each month, and then bills at the nearest rate. In this way infrequent peaks are ignored, and the customer is charged in a fairer way. The reason this statistic is so useful in measuring data throughput is that it gives a very accurate picture of the cost of the bandwidth. The 95th percentile says that 95% of the time, the usage is below this amount. Just the same, the remaining 5% of the time, the usage is above that amount.
Physicians will often use infant and children's weight and height percentile
to assess their growth in comparison to national averages.
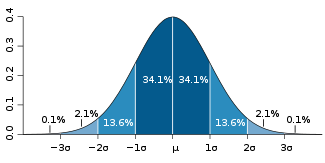 The methods given above are approximations for use in small-sample statistics. In general terms, for very large populations percentiles may often be represented by reference to a normal curve plot. The normal curve is plotted along an axis scaled to standard deviation
, or sigma, units. Mathematically, the normal curve extends to negative infinity
on the left and positive infinity on the right. Note, however, that a very small portion of individuals in a population will fall outside the −3 to +3 range.
In humans, for example, a small portion of all people can be expected to fall above the +3 sigma height level.
Percentiles represent the area under the normal curve, increasing from left to right. Each standard deviation represents a fixed percentile. Thus, rounding to two decimal places, −3 is the 0.13th percentile, −2 the 2.28th percentile, −1 the 15.87th percentile, 0 the 50th percentile (both the mean and median of the distribution), +1 the 84.13th percentile, +2 the 97.72nd percentile, and +3 the 99.87th percentile. Note that the 0th percentile falls at negative infinity and the 100th percentile at positive infinity.
Statistics
Statistics is the study of the collection, organization, analysis, and interpretation of data. It deals with all aspects of this, including the planning of data collection in terms of the design of surveys and experiments....
, a percentile (or centile) is the value of a variable below which a certain percent
Percentage
In mathematics, a percentage is a way of expressing a number as a fraction of 100 . It is often denoted using the percent sign, “%”, or the abbreviation “pct”. For example, 45% is equal to 45/100, or 0.45.Percentages are used to express how large/small one quantity is, relative to another quantity...
of observations fall. For example, the 20th percentile is the value (or score) below which 20 percent of the observations may be found. The term percentile and the related term percentile rank
Percentile rank
The percentile rank of a score is the percentage of scores in its frequency distribution that are the same or lower than it. For example, a test score that is greater than 75% of the scores of people taking the test is said to be at the 75th percentile....
are often used in the reporting of scores from norm-referenced test
Norm-referenced test
A norm-referenced test is a type of test, assessment, or evaluation which yields an estimate of the position of the tested individual in a predefined population, with respect to the trait being measured. This estimate is derived from the analysis of test scores and possibly other relevant data...
s.
The 25th percentile is also known as the first quartile
Quartile
In descriptive statistics, the quartiles of a set of values are the three points that divide the data set into four equal groups, each representing a fourth of the population being sampled...
(Q1), the 50th percentile as the median
Median
In probability theory and statistics, a median is described as the numerical value separating the higher half of a sample, a population, or a probability distribution, from the lower half. The median of a finite list of numbers can be found by arranging all the observations from lowest value to...
or second quartile (Q2), and the 75th percentile as the third quartile (Q3).
Definition
There is no standard definition of percentile,however all definitions yield similar results when the number of observations is very large.
Nearest rank
One definition of percentile, often given in texts, is that the P-th percentile () of N ordered values (arranged from least to greatest) is obtained by first calculating the (ordinalOrdinal
Ordinal may refer to:* Ordinal number , a word representing the rank of a number* Ordinal scale, ranking things that are not necessarily numbers* Ordinal indicator, the sign adjacent to a numeral denoting that it is an ordinal number...
) rank
Ranking
A ranking is a relationship between a set of items such that, for any two items, the first is either 'ranked higher than', 'ranked lower than' or 'ranked equal to' the second....

rounding the result to the nearest integer, and then taking the value that corresponds to that rank. (Note that the rounded value of n is just the least integer which exceeds
.)For example, by this definition, given the numbers
- 15, 20, 35, 40, 50
the rank of the 30th percentile would be
-
 .
.
Thus the 30th percentile is the second number in the sorted list, 20.
The 40th percentile would have rank
-
 ,
,
so the 40th percentile would be the third number (since 2.5 rounds up to 3), or 35.
The 100th percentile is defined to be the largest value. (In this case we do not use the above definition with P=100, because the rank n would be greater than the number N of values in the original list.)
Linear interpolation between closest ranks
An alternative to rounding used in many applications is to use linear interpolationLinear interpolation
Linear interpolation is a method of curve fitting using linear polynomials. Lerp is an abbreviation for linear interpolation, which can also be used as a verb .-Linear interpolation between two known points:...
between the two nearest ranks.
In particular, given the N sorted values
, we define the percent rank corresponding to the nth value as:
-
 .
.
In this way, for example, if
the percent rank corresponding to the third value is
-
 .
.
The value v of the P-th percentile may now be calculated as follows:
If
or , then we take or , respectively.If there is some integer k for which
, then we take .Otherwise, we find the integer k for which
, and take
-
 .
.
Using the list of numbers above, the 40th percentile would be found by linearly interpolating between the 30th percentile, 20, and the 50th, 35. Specifically:
This is halfway between 20 and 35, which one would expect since the rank was calculated above as 2.5.
It is readily confirmed that the 50th percentile of any list of values according to this definition of the P-th percentile is just the sample median.
Moreover, when N is even the 25th percentile according to this definition of the P-th percentile is the median of the first
values (i.e., the median of the lower half of the data).Weighted percentile
In addition to the percentile function, there is also a weighted percentile, where the percentage in the total weight is counted instead of the total number. There is no standard function for a weighted percentile. One method extends the above approach is a natural way.Suppose we have positive weights
associated, respectively, with our N sorted sample values. Let
-
 ,
,
the
-th partial sum of the weights. Then the formulas above are generalized by taking

and
-
 .
.
Alternative methods
Some software packages, including Microsoft ExcelMicrosoft Excel
Microsoft Excel is a proprietary commercial spreadsheet application written and distributed by Microsoft for Microsoft Windows and Mac OS X. It features calculation, graphing tools, pivot tables, and a macro programming language called Visual Basic for Applications...
use the following method, noted as an alternative by NIST
National Institute of Standards and Technology
The National Institute of Standards and Technology , known between 1901 and 1988 as the National Bureau of Standards , is a measurement standards laboratory, otherwise known as a National Metrological Institute , which is a non-regulatory agency of the United States Department of Commerce...
to estimate the value,
, of the P-th percentile of an ascending ordered dataset containing N elements with values .The rank is calculated:
and then split into its integer component k and decimal component d, such that
. Then is calculated as:The primary method recommended by NIST
National Institute of Standards and Technology
The National Institute of Standards and Technology , known between 1901 and 1988 as the National Bureau of Standards , is a measurement standards laboratory, otherwise known as a National Metrological Institute , which is a non-regulatory agency of the United States Department of Commerce...
is similar to that given above, but with the rank calculated as

These two approaches give the rank of the 40th percentile in the above example as, respectively:
and
-
 .
.
The values are then interpolated as usual based on these ranks, yielding 29 and 26, respectively, for the 40th percentile.
Applications
When ISPsInternet service provider
An Internet service provider is a company that provides access to the Internet. Access ISPs directly connect customers to the Internet using copper wires, wireless or fiber-optic connections. Hosting ISPs lease server space for smaller businesses and host other people servers...
bill "burstable" internet bandwidth
Burstable billing
Burstable billing is a method of measuring bandwidth based on peak utilization. It also allows usage to exceed a specified threshold for brief periods of time without the financial penalty of purchasing a higher Committed Information Rate from an Internet service provider .Most ISPs use a five...
, the 95th or 98th percentile usually cuts off the top 5% or 2% of bandwidth peaks in each month, and then bills at the nearest rate. In this way infrequent peaks are ignored, and the customer is charged in a fairer way. The reason this statistic is so useful in measuring data throughput is that it gives a very accurate picture of the cost of the bandwidth. The 95th percentile says that 95% of the time, the usage is below this amount. Just the same, the remaining 5% of the time, the usage is above that amount.
Physicians will often use infant and children's weight and height percentile
Weight and Height Percentile
Weight and height percentiles are determined by growth charts and body mass index charts to compare a child's measurements with those of other children in the same age group. By doing this, doctors can track a child's growth over time and monitor how a child is growing in relation to other children...
to assess their growth in comparison to national averages.
The normal curve and percentiles
Standard deviation
Standard deviation is a widely used measure of variability or diversity used in statistics and probability theory. It shows how much variation or "dispersion" there is from the average...
, or sigma, units. Mathematically, the normal curve extends to negative infinity
Infinity
Infinity is a concept in many fields, most predominantly mathematics and physics, that refers to a quantity without bound or end. People have developed various ideas throughout history about the nature of infinity...
on the left and positive infinity on the right. Note, however, that a very small portion of individuals in a population will fall outside the −3 to +3 range.
In humans, for example, a small portion of all people can be expected to fall above the +3 sigma height level.
Percentiles represent the area under the normal curve, increasing from left to right. Each standard deviation represents a fixed percentile. Thus, rounding to two decimal places, −3 is the 0.13th percentile, −2 the 2.28th percentile, −1 the 15.87th percentile, 0 the 50th percentile (both the mean and median of the distribution), +1 the 84.13th percentile, +2 the 97.72nd percentile, and +3 the 99.87th percentile. Note that the 0th percentile falls at negative infinity and the 100th percentile at positive infinity.
External links
- Free Online Software (Calculator) computes Percentiles for any dataset according to 8 different percentile definitions.