

Official statistics
Encyclopedia
Official statistics are statistics
published by government agencies
or other public bodies such as international organizations. They provide quantitative or qualitative information on all major areas of citizens' lives, such as economic and social development, living conditions, health
, education
, and the environment.
During the 16th and 17th centuries, statistics were a method for counting and listing populations and State resources. The term statistics comes from the Latin status (state) indicating that the origin of the profession related to the needs of governments. According to the Organization for Economic Cooperation and Development, official statistics are statistics disseminated by the national statistical system, excepting those that are explicitly not to be official".
Of course, governmental agencies at all levels, including municipal, county, and state administrations, may generate and disseminate official statistics. This broader possibility is accommodated by another definition, given by Beimer and Lyberg in 2003
"Almost every country in the world has one or more government agencies (usually national institutes) that supply decision-makers and other users including the general public and the research community with a continuing flow of information (...). This bulk of data is usually called official statistics. Official statistics should be objective and easily accessible and produced on a continuing basis so that measurement of change is possible."
Official statistics result from the collection and processing of data into statistical information by a government institution or international organisation. They are then disseminated to help users develop their knowledge about a particular topic or geographical area, make comparisons between countries or understand changes over time. Official statistics make information on economic and social development accessible to the public, allowing the impact of government policies to be assessed, thus improving accountability.
and maps
. Statistical information covers different subject areas (economic, demographic, social
etc.). It provides basic information for decision making
, evaluations and assessments at different levels.
The goal of statistical organizations is to produce relevant, objective and accurate statistics to keep users well informed and assist good policy and decision-making.
, and subsequently endorsed as a global standard by the United Nations Statistical Commission. According to the first Principle "Official statistics provide an indispensable element in the information system of a democratic society, serving the government, the economy and the public with data about the economic, demographic, social and environmental situation".
The categorization of the domains of official statistics has been further developed in the Classification of Statistical Activities, endorsed by the Coference of European Statisticians and various other bodies.
For population, the main indicators are:
The gender statistics include:
In the employment category:
There are many indicators for the economy:
For trade indicators we find:
Environment indicators:
For the energy field:
 Official statistics are intended for a wide range of users including governments (central and local), research institutions, professional statisticians, journalists and the media, businesses, educational institutions and the general public.
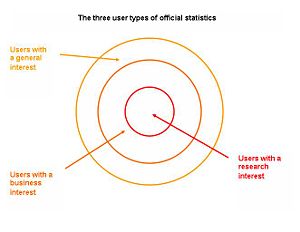
There are three types of users: those with a general interest, business interest or research interest. Each of these user groups has different needs for statistical information.
. As with the general interest users, this group does not usually have a good understanding of statistical methodologies, but they need more detailed information than the general users.
One common point for all these users is their need to be able to trust the official information. They need to be confident that the results published are authoritative and unbiased. Producers of official statistics must maintain a reputation of professionalism and independence.
The statistical system must be free from interference that could influence decisions on the choice of sources, methods used for data collection, the selection of results to be released as official, and the timing and form of dissemination. Statistical business processes should be transparent and follow international standards of good practice.
Statistical programs are decided on an annual or multi-annual basis by governments in many countries. They also provide a way to judge the performance of the statistical system.
The core tasks of NSOs, for both centralized and decentralized systems, are determining user needs and filtering these for relevance. Then they transform the relevant user needs into measurable concepts to facilitate data collection and dissemination. The NSO is in charge of the coordination between statistical producers and of ensuring the coherence and compliance of the statistical system to agreed standards. The NSO has a coordination responsibility as its President/Director General represents the entire national system of official statistics, both at the national and at international levels.
In order to understand the accuracy of economic data and the possible impact of data errors on macroeconomic decision-making, the Federal Reserve Bank of Philadelphia
has published a dataset that records both initial real-time data estimates, and subsequent data revisions, for a large number of macroeconomic series. A similar dataset for Europe has been developed by the Euro-Area Business Cycle Network.
or a sample survey is an investigation about the characteristics of a phenomenon by means of collecting data from a sample of the population and estimating their characteristics through the systematic use of statistical methodology.
There are various survey methods that can be used such as direct interviewing, telephone, mail, online surveys.
In 2005, the United Nations Economic and Social Council adopted a resolution urging: "Member States to carry out a population and housing census and to disseminate census results as an essential source of information for small area, national, regional and international planning and development; and to provide census results to national stakeholders as well as the United Nations and other appropriate intergovernmental organizations to assist in studies on population, environment, and socio-economic development issues and programs".
There are different types of registers:
→Administrative registers or records can help the NSI in collecting data. Using the existing administrative data for statistical production may be approved by the public because it can be seen as a cost efficient method; individuals and enterprises are less harassed by a response burden; data security is better as fewer people handle it and data have an electronic format.
→Private registers such as registers operated by insurance companies and employer organizations can also be used in the production process of official statistics, providing there is an agreement or legislation on this.
→Statistical registers are frequently based on combined data from different administrative registers or other data sources.
→For businesses, it is often legally indispensable to be registered in their country to a business register which is a system that makes business information collection easier.
→It is possible to find agricultural registers and registers of dwellings.
Even though different types of data collection exist, the best estimates are based on a combination of different sources providing the strengths and reducing the weakness of each individual source.
There are different types of graphic but usually the data determine the type that is going to be used.
Television is the primary news source for citizens in industrialized countries, even if radio and newspapers still play an important role in the dissemination of statistical information. On the other hand newspapers and specialized economic and social magazines can provide more detailed coverage of statistical releases as the information on a specific theme can be quite extensive. Official statistics provides us with important information on the situation and the development trends in our society.
Users can gather information making use of the services of the National Statistical Offices. They can easily find it on the agency's website.
The development of computing technologies and the Internet has enabled users - businesses, educational institutions and households among others- to have access to statistical information. The Internet has become an important tool for statistical producers to disseminate their data and information. People are able to access information online. The supply of information from statistical agencies has increased. Today the advanced agencies provide the information on their websites in an understandable way, often categorized for different groups of users.
Several glossaries have been set up by different organizations or statistical offices to provide more information and definitions in the field of statistics and consequently official statistics.
, SDDS for Special Data Dissemination Standards and GDDS for General Data Dissemination System. Their aim is to guide countries in the dissemination of their economic and financial data to the public. One approved, these standards have to be observed by all producers of official statistics and not only by the NSO.
Lists
Statistics
Statistics is the study of the collection, organization, analysis, and interpretation of data. It deals with all aspects of this, including the planning of data collection in terms of the design of surveys and experiments....
published by government agencies
Government
Government refers to the legislators, administrators, and arbitrators in the administrative bureaucracy who control a state at a given time, and to the system of government by which they are organized...
or other public bodies such as international organizations. They provide quantitative or qualitative information on all major areas of citizens' lives, such as economic and social development, living conditions, health
Health
Health is the level of functional or metabolic efficiency of a living being. In humans, it is the general condition of a person's mind, body and spirit, usually meaning to be free from illness, injury or pain...
, education
Education
Education in its broadest, general sense is the means through which the aims and habits of a group of people lives on from one generation to the next. Generally, it occurs through any experience that has a formative effect on the way one thinks, feels, or acts...
, and the environment.
During the 16th and 17th centuries, statistics were a method for counting and listing populations and State resources. The term statistics comes from the Latin status (state) indicating that the origin of the profession related to the needs of governments. According to the Organization for Economic Cooperation and Development, official statistics are statistics disseminated by the national statistical system, excepting those that are explicitly not to be official".
Of course, governmental agencies at all levels, including municipal, county, and state administrations, may generate and disseminate official statistics. This broader possibility is accommodated by another definition, given by Beimer and Lyberg in 2003
"Almost every country in the world has one or more government agencies (usually national institutes) that supply decision-makers and other users including the general public and the research community with a continuing flow of information (...). This bulk of data is usually called official statistics. Official statistics should be objective and easily accessible and produced on a continuing basis so that measurement of change is possible."
Official statistics result from the collection and processing of data into statistical information by a government institution or international organisation. They are then disseminated to help users develop their knowledge about a particular topic or geographical area, make comparisons between countries or understand changes over time. Official statistics make information on economic and social development accessible to the public, allowing the impact of government policies to be assessed, thus improving accountability.
Aim
Official statistics provide a picture of a country or different phenomena through data, and images such as graphChart
A chart is a graphical representation of data, in which "the data is represented by symbols, such as bars in a bar chart, lines in a line chart, or slices in a pie chart"...
and maps
MAPS
Maps is the plural of map, a visual representation of an area.As an acronym, MAPS may refer to:* Mail Abuse Prevention System, an organisation that provides anti-spam support...
. Statistical information covers different subject areas (economic, demographic, social
Social
The term social refers to a characteristic of living organisms...
etc.). It provides basic information for decision making
Decision making
Decision making can be regarded as the mental processes resulting in the selection of a course of action among several alternative scenarios. Every decision making process produces a final choice. The output can be an action or an opinion of choice.- Overview :Human performance in decision terms...
, evaluations and assessments at different levels.
The goal of statistical organizations is to produce relevant, objective and accurate statistics to keep users well informed and assist good policy and decision-making.
Various categories
The Fundamental Principles of Official Statistics were adopted in 1992 by the United Nations Economic Commission for EuropeUnited Nations Economic Commission for Europe
The United Nations Economic Commission for Europe was established in 1947 to encourage economic cooperation among its member states. It is one of five regional commissions under the administrative direction of United Nations headquarters. It has 56 member states, and reports to the UN Economic and...
, and subsequently endorsed as a global standard by the United Nations Statistical Commission. According to the first Principle "Official statistics provide an indispensable element in the information system of a democratic society, serving the government, the economy and the public with data about the economic, demographic, social and environmental situation".
The categorization of the domains of official statistics has been further developed in the Classification of Statistical Activities, endorsed by the Coference of European Statisticians and various other bodies.
Most common indicators used in official statistics
Statistical indicators provide an overview of the social, demographic and economic structure of society. Moreover, these indicators facilitate comparisons between countries and regions.For population, the main indicators are:
- Total population
- Population density
- Population by age
- Life expectancyLife expectancyLife expectancy is the expected number of years of life remaining at a given age. It is denoted by ex, which means the average number of subsequent years of life for someone now aged x, according to a particular mortality experience...
at birth and at age 65 - Foreign bornForeign bornForeign born is a term used to describe a person born outside of their country of residence. Foreign born are often non-citizens, but are also frequently naturalized citizens of a country....
- Foreigners in population
- Total fertility rateTotal Fertility RateThe total fertility rate of a population is the average number of children that would be born to a woman over her lifetime if she were to experience the exact current age-specific fertility rates through her lifetime, and she...
- Infant mortalityInfant mortalityInfant mortality is defined as the number of infant deaths per 1000 live births. Traditionally, the most common cause worldwide was dehydration from diarrhea. However, the spreading information about Oral Re-hydration Solution to mothers around the world has decreased the rate of children dying...
The gender statistics include:
- Women in labour force
- Gender pay gap
In the employment category:
- Employment rate
- Unemployment rate
- Youth unemployment rate
- Economic activity rateEconomic activity rateEconomic activity rate is the percentage of the population, both employed and unemployed, who constitutes the manpower supply of the labor market regardless of their current labor status....
(women and men) - Employment in major sectors: agriculture, industry, services
There are many indicators for the economy:
- Gross Domestic ProductGross domestic productGross domestic product refers to the market value of all final goods and services produced within a country in a given period. GDP per capita is often considered an indicator of a country's standard of living....
- Gross Domestic Product per capita
- Real GDP growth rate
- GDP by major economic sectors: agriculture, industry, services
- Consumer price indexConsumer price indexA consumer price index measures changes in the price level of consumer goods and services purchased by households. The CPI, in the United States is defined by the Bureau of Labor Statistics as "a measure of the average change over time in the prices paid by urban consumers for a market basket of...
- Purchasing Power ParityPurchasing power parityIn economics, purchasing power parity is a condition between countries where an amount of money has the same purchasing power in different countries. The prices of the goods between the countries would only reflect the exchange rates...
- Exchange rateExchange rateIn finance, an exchange rate between two currencies is the rate at which one currency will be exchanged for another. It is also regarded as the value of one country’s currency in terms of another currency...
- Gross external debt
For trade indicators we find:
- Exports of goods and services
- Imports of goods and services
- Balance of paymentsBalance of paymentsBalance of payments accounts are an accounting record of all monetary transactions between a country and the rest of the world.These transactions include payments for the country's exports and imports of goods, services, financial capital, and financial transfers...
- Trade balance
- Major import partners
- Major export partners
Environment indicators:
- Land use
- Water supply and consumption
- Environmental protection expenditureEnvironmental protection expenditure accountsEnvironmental Protection Expenditure Account is a statistical framework that describes environmental activities in monetary terms and organises these statistics into a full set of accounts, just like that of the national accounts. The EPEA results in a net national total expenditure for...
- Generation and treatment of waste
- Chemical use
For the energy field:
- Total energy consumption
- Primary energy sources
- Energy consumption in transport
- Electricity consumption
- Consumption of renewable energy sources
Users
There are three types of users: those with a general interest, business interest or research interest. Each of these user groups has different needs for statistical information.
Users with a general interest
Users with a general interest include the media, schools and the general public. They use official statistics in order to be informed on a particular topic, to observe trends within the society of a local area, country, region of the world.Users with a business interest
Users with a business interest include decision makers and users with a particular interest for which they want more detailed information. For them, official statistics are an important reference, providing information on the phenomena or circumstances their own work is focusing on. For instance, those users will take some official statistics into consideration before launching a product, or deciding on a specific policy or on a marketing strategyMarketing strategy
Marketing strategy is a process that can allow an organization to concentrate its limited resources on the greatest opportunities to increase sales and achieve a sustainable competitive advantage.-Developing a marketing strategy:...
. As with the general interest users, this group does not usually have a good understanding of statistical methodologies, but they need more detailed information than the general users.
Users with a research interest
Users with a research interest are universities, consultants and government agencies. They generally understand something about statistical methodology and want to dig deeper into the facts and the statistical observations; they have an analytical purpose in inventing or explaining interrelations of causes and effects of different phenomena. In this field, official statistics are also used to assess a government's policies.One common point for all these users is their need to be able to trust the official information. They need to be confident that the results published are authoritative and unbiased. Producers of official statistics must maintain a reputation of professionalism and independence.
The statistical system must be free from interference that could influence decisions on the choice of sources, methods used for data collection, the selection of results to be released as official, and the timing and form of dissemination. Statistical business processes should be transparent and follow international standards of good practice.
Statistical programs are decided on an annual or multi-annual basis by governments in many countries. They also provide a way to judge the performance of the statistical system.
Producers at the national level
Official statistics are collected and produced by national statistical organisations (NSOs), or other organisations (e.g. cantral banks) that form part of the national statistical system in countries where statistical production is de-centralized. These organisations are responsible for producing and disseminating official statistical information, providing the highest quality data. Quality in the context of official statistics is a multi-faceted concept, consisting of components such as relevance, completeness, timeliness, accuracy, accessibility, clarity, cost-efficiency, transparency, comparability and coherence.The core tasks of NSOs, for both centralized and decentralized systems, are determining user needs and filtering these for relevance. Then they transform the relevant user needs into measurable concepts to facilitate data collection and dissemination. The NSO is in charge of the coordination between statistical producers and of ensuring the coherence and compliance of the statistical system to agreed standards. The NSO has a coordination responsibility as its President/Director General represents the entire national system of official statistics, both at the national and at international levels.
Production process
The production process of official statistics comprises 9 phases, as documented in the Generic Statistical Business Process Model- Specify Needs
- Design
- Build
- Collect
- Process
- Analyse
- Disseminate
- Archive
- Evaluate
Data revision
Even after they have been published, some official statistics may be revised. Policy-makers may need preliminary statistics quickly for decision-making purposes, but eventually it is important to publish the best available information, so official statistics are often published in several 'vintages'.In order to understand the accuracy of economic data and the possible impact of data errors on macroeconomic decision-making, the Federal Reserve Bank of Philadelphia
Federal Reserve Bank of Philadelphia
The Federal Reserve Bank of Philadelphia, headquartered in Philadelphia, Pennsylvania, is responsible for the Third District of the Federal Reserve, which covers eastern Pennsylvania, the 9 southern counties of New Jersey, and Delaware...
has published a dataset that records both initial real-time data estimates, and subsequent data revisions, for a large number of macroeconomic series. A similar dataset for Europe has been developed by the Euro-Area Business Cycle Network.
Data Sources
There are two sources of data for statistics. Primary, or "statistical" sources are data that are collected primarily for creating official statistics, and include statistical surveys and censuses. Secondary, or "non-statistical" sources, are data that have been primarily collected for some other purpose (administrative data, private sector data etc.).Statistical survey or sample survey
A statistical surveyStatistical survey
Survey methodology is the field that studies surveys, that is, the sample of individuals from a population with a view towards making statistical inferences about the population using the sample. Polls about public opinion, such as political beliefs, are reported in the news media in democracies....
or a sample survey is an investigation about the characteristics of a phenomenon by means of collecting data from a sample of the population and estimating their characteristics through the systematic use of statistical methodology.
-
- The main advantages are the direct control over data collection and the possibility to ask for data according to statistical definitions.
- Disadvantages include the high cost of data collection and the quality issues relating to non-response and survey errors.
There are various survey methods that can be used such as direct interviewing, telephone, mail, online surveys.
Census
A census is a complete enumeration of a population or groups at a point in time with respect to well-defined characteristics (population, production). Data are collected for a specific reference period. A census should be taken at regular intervals in order to have comparable information available, therefore, most statistical censuses are conducted every 5 or 10 years. Data are usually collected through questionnaires mailed to respondents, via the Internet, or completed by an enumerator visiting respondents, or contacting them by telephone.-
- An advantage is that censuses provide better data than surveys for small geographic areas or sub-groups of the population. Census data can also provide a basis for sampling frames used in subsequent surveys.
- The major disadvantage of censuses is usually the high cost associated with planning and conducting them, and processing the resulting data.
In 2005, the United Nations Economic and Social Council adopted a resolution urging: "Member States to carry out a population and housing census and to disseminate census results as an essential source of information for small area, national, regional and international planning and development; and to provide census results to national stakeholders as well as the United Nations and other appropriate intergovernmental organizations to assist in studies on population, environment, and socio-economic development issues and programs".
Register
A register is a database that is updated continuously for a specific purpose and from which statistics can be collected and produced. It contains information on a complete group of units.-
- An advantage is the total coverage even if collecting and processing represent low cost. It allows producing more detailed statistics than using surveys. Different registers can be combined and linked together on the basis of defined keys (personal identification codes, business identification codes, address codes etc.). Moreover, individual administrative registers are usually of high quality and very detailed.
- A disadvantage is the possible under-coverage that can be the case if the incentive or the cultural tradition of registering events and changes are weak, if the classification principles of the register are not clearly defined or if the classifications do not correspond to the needs of statistical production to be derived from them.
There are different types of registers:
→Administrative registers or records can help the NSI in collecting data. Using the existing administrative data for statistical production may be approved by the public because it can be seen as a cost efficient method; individuals and enterprises are less harassed by a response burden; data security is better as fewer people handle it and data have an electronic format.
→Private registers such as registers operated by insurance companies and employer organizations can also be used in the production process of official statistics, providing there is an agreement or legislation on this.
→Statistical registers are frequently based on combined data from different administrative registers or other data sources.
→For businesses, it is often legally indispensable to be registered in their country to a business register which is a system that makes business information collection easier.
→It is possible to find agricultural registers and registers of dwellings.
Even though different types of data collection exist, the best estimates are based on a combination of different sources providing the strengths and reducing the weakness of each individual source.
Official Statistics presentation
Official statistics can be presented in different ways. Analytical texts and tables are the most traditional ways. Graphs and charts summarize data highlighting information content visually. They can be extremely effective in expressing key results, or illustrating a presentation. Sometimes a picture is worth a thousand words. Graphs and charts usually have a heading describing the topic.There are different types of graphic but usually the data determine the type that is going to be used.
- To illustrate changes over time, a line graphLine graphIn graph theory, the line graph L of undirected graph G is another graph L that represents the adjacencies between edges of G...
would be recommended. This is usually used to display variables whose values represent a regular progression.
- For categorical data, it is better to use a bar graph either vertical or horizontal. They are often used to represent percentages and rates and also to compare countries, groups or illustrate changes over time. The same variable can be plotted against itself for two groups. An example of this is the age pyramid.
- Pie chartPie chartA pie chart is a circular chart divided into sectors, illustrating proportion. In a pie chart, the arc length of each sector , is proportional to the quantity it represents. When angles are measured with 1 turn as unit then a number of percent is identified with the same number of centiturns...
can be used to represent share of 100 per cent. Pie charts highlight the topic well only when there are few segments. - Stacked bar charts, whether vertical or horizontal, are used to compare compositions across categories. They can be used to compare percentage composition and are most effective for categories that add up to 100 per cent, which make a full stacked bar chart. Their use is usually restricted to a small number of categories.
- Tables are a complement to related texts and support the analysis. They help to minimize numbers in the description and also eliminate the need to discuss small variables that are not essential. Tables rank data by order or other hierarchies to make the numbers easily understandable. They usually show the figures from the highest to the lowest.
- Another type of visual presentation of statistical information is thematic mapThematic mapA thematic map is a type of map or chart especially designed to show a particular theme connected with a specific geographic area. These maps "can portray physical, social, political, cultural, economic, sociological, agricultural, or any other aspects of a city, state, region,nation , or...
. They can be used to illustrate differences or similarities between geographical areas, regions or countries. The most common statistical map that is used is called the choropleth mapChoropleth mapA choropleth map A choropleth map A choropleth map (Greek χώρος + πληθαίν:, ("area/region" + "multiply") is a thematic map in which areas are shaded or patterned in proportion to the measurement of the statistical variable being displayed on the map, such as population density or per-capita...
where different shades of a colour are used to highlight contrasts between regions; darker colour means a greater statistical value. This type of map is best used for ratio data but for other data, proportional or graduated symbol maps, such as circles, are preferred. The size of the symbol increases in proportion to the value of the observed object.
Release
Official statistics are part of our everyday life. They are everywhere: in newspapers, on television and radio, in presentations and discussions. For most citizens, the media provide their only exposure to official statistics.Television is the primary news source for citizens in industrialized countries, even if radio and newspapers still play an important role in the dissemination of statistical information. On the other hand newspapers and specialized economic and social magazines can provide more detailed coverage of statistical releases as the information on a specific theme can be quite extensive. Official statistics provides us with important information on the situation and the development trends in our society.
Users can gather information making use of the services of the National Statistical Offices. They can easily find it on the agency's website.
The development of computing technologies and the Internet has enabled users - businesses, educational institutions and households among others- to have access to statistical information. The Internet has become an important tool for statistical producers to disseminate their data and information. People are able to access information online. The supply of information from statistical agencies has increased. Today the advanced agencies provide the information on their websites in an understandable way, often categorized for different groups of users.
Several glossaries have been set up by different organizations or statistical offices to provide more information and definitions in the field of statistics and consequently official statistics.
Quality criteria to be respected
The quality criteria of a national statistical office are the following: relevance, impartiality, dissemination, independence, transparency, confidentiality, international standards. There principles apply not only to the NSO but to all producers of official statistics. Therefore, not every figure reported by a public body should be considered as official statistics, but those produced and disseminated according to the principles. Adherence to these principles will enhance the credibility of the NSO and other official statistical producers and build public trust in the reliability of the information and results that are produced.Relevance
Relevance is the first and most important principles to be respected for national statistical offices. When releasing information, data and official statistics should be relevant in order to fulfil the needs of users as well as both public and private sector decision makers. Production of official statistics is relevant if it corresponds to different user needs like public, governments, businesses, research community, educational institutions, NGOs and international organizations or if it satisfies basic information in each area and citizen's right to information.Impartiality
Once the survey has been made, the NSO checks the quality of the results and then they have to be disseminated no matter what impact they can have on some users, whether good or bad. All should accept the results released by the NSO as authoritative. Users need to perceive the results as unbiased representation of relevant aspects of the society. Moreover, the impartiality principle implies the fact that NSOs have to use understandable terminology for statistics' dissemination, questionnaires and material published so that everyone can have access to their information. MaribelleDissemination
In order to maximize dissemination, statistics should be presented in a way that facilitates proper interpretation and meaningful comparisons. To reach the general public and non-expert users when disseminating, NSOs have to add explanatory comments to explain the significance of the results released and make analytical comments when necessary. There is a need to identify clearly what the preliminary, final and revised results are, in order to avoid confusion for users. All results of official statistics have to be publicly accessible. There are no results that should be characterized as official and for the exclusive use of the government. Moreover they should be disseminated simultaneously.Independence
Users can be consulted by NSOs but the decisions should be made by statistical bodies. Information and activities of producers of official statistics should be independent of political control. Moreover, NSOs have to be free of any political interference that could influence their work and thus, the results. They should not make any political advice or policy-perspective comments on the results released at anytime, even at press conferences or in interviews with the media.Transparency
The need for transparency is essential for NSOs to gain the trust of the public. They have to expose to the public the methods they use to produce official statistics, and be accountable for all the decisions they take and the results they publish. Also, statistical producers should warn users of certain interpretations and false conclusions even if they try to be as precise as possible. Furthermore, the quality of the accurate and timely results must be assessed prior to release. But if errors in the results occur before or after the data revision, they should be directly corrected and information should be disseminated to the users at the earliest possible time. Producers of official statistics have to set analytical systems in order to change or improve their activities and methods.Confidentiality
All data collected by the national statistical office must protect the privacy of individual respondents, whether persons or businesses. But on the contrary, government units such as institutions cannot invoke statistical confidentiality. All respondents have to be informed about the purpose and legal basis of the survey and especially about the confidentiality measures. The statistical office should not release any information that could identify an individual or group without prior consent. After data collection, replies should go back directly to the statistical producer, without involving any intermediary. Data processing implies that filled-in paper and electronic form with full names should be destroyed.International standards
The use of international standards at the national level aims to improve international comparability for national users and facilitate decision-making, especially when controversial. Moreover, the overall structure, including concepts and definitions, should follow internationally accepted standards, guidelines or good practices. International recommendations and standards for statistical methods approved by many countries provide them with a common basis like the two standards of the International Monetary FundInternational Monetary Fund
The International Monetary Fund is an organization of 187 countries, working to foster global monetary cooperation, secure financial stability, facilitate international trade, promote high employment and sustainable economic growth, and reduce poverty around the world...
, SDDS for Special Data Dissemination Standards and GDDS for General Data Dissemination System. Their aim is to guide countries in the dissemination of their economic and financial data to the public. One approved, these standards have to be observed by all producers of official statistics and not only by the NSO.
See also
Related topics- Statistical surveyStatistical surveySurvey methodology is the field that studies surveys, that is, the sample of individuals from a population with a view towards making statistical inferences about the population using the sample. Polls about public opinion, such as political beliefs, are reported in the news media in democracies....
- SamplingSampling (statistics)In statistics and survey methodology, sampling is concerned with the selection of a subset of individuals from within a population to estimate characteristics of the whole population....
- Questionnaire constructionQuestionnaire constructionA questionnaire is a series of questions asked to individuals to obtain statistically useful information about a given topic. When properly constructed and responsibly administered, questionnaires become a vital instrument by which statements can be made about specific groups or people or entire...
- MarketingMarketingMarketing is the process used to determine what products or services may be of interest to customers, and the strategy to use in sales, communications and business development. It generates the strategy that underlies sales techniques, business communication, and business developments...
- ForecastingForecastingForecasting is the process of making statements about events whose actual outcomes have not yet been observed. A commonplace example might be estimation for some variable of interest at some specified future date. Prediction is a similar, but more general term...
- Qualitative marketing researchQualitative marketing researchQualitative marketing research is a set of research techniques, used in marketing and the social sciences, in which data is obtained from a relatively small group of respondents and not analyzed with inferential statistics...
- Quantitative marketing researchQuantitative marketing researchQuantitative marketing research is the application of quantitative research techniques to the field of marketing. It has roots in both the positivist view of the world, and the modern marketing viewpoint that marketing is an interactive process in which both the buyer and seller reach a satisfying...
- Focus groupFocus groupA focus group is a form of qualitative research in which a group of people are asked about their perceptions, opinions, beliefs and attitudes towards a product, service, concept, advertisement, idea, or packaging...
- BenchmarkingBenchmarkingBenchmarking is the process of comparing one's business processes and performance metrics to industry bests and/or best practices from other industries. Dimensions typically measured are quality, time and cost...
- Journal of Official StatisticsJournal of Official StatisticsThe Journal of Official Statistics is a peer-reviewed scientific journal that publishes papers related to official statistics. It is published by Statistics Sweden, the national statistical office of Sweden. The journal was established in 1985, when it replaced the Swedish language journal...
Lists
National statistical institutes for official statistics
- Producers and publishers of statistics
- Producers and publishers of statistics of the UNECE Member Countries
International organizations
- United Nations Economic Commission for Europe (UNECE) Statistics
- United Nations Statistics Division (UNSD)
- Organisation for Economic Co-operation and Development (OECD) Statistics
- Eurostat
- System of National Accounts 1993 (SNA)
- Statistical Data and Metadata Exchange (SDMX)
- International Monetary Fund (IMF) Data and Statistics
- International Labour Office (ILO) Statistics
- United Nations Industrial Development Organisation (UNIDO) Statistics
- World Bank Data
- World Health Organization (WHO) Data and Statistics
- World Trade Organization (WTO)
General information
- UNECE Database
- International Association for Official Statistics
- Handbook of Official Statistics in the UNECE Region
- The OECD Statistics Newsletter
- Principles of Forecasting
- Quality Guidelines for Official Statistics (2nd revised edition)
Glossaries
- UNECE Glossary
- UNECE Gender Glossary
- United Nations Glossary
- Organization for Economic Cooperation and Development (OECD) Glossary of Statistical Terms
- SDMX Glossary
- Eurostat Glossary
- International Statistical Institute (ISI) Multilingual Glossary of Statistical Terms
- UNESCO Institute for Statistics Glossary
Further reading
- Giovanini, Enrico Understanding Economic Statistics, OECD Publishing, 2008, ISBN 978-92-64-03312-2