

Nyquist plot
Encyclopedia
Signal processing
Signal processing is an area of systems engineering, electrical engineering and applied mathematics that deals with operations on or analysis of signals, in either discrete or continuous time...
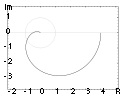
. The most common use of Nyquist plots is for assessing the stability of a system with feedback
Feedback
Feedback describes the situation when output from an event or phenomenon in the past will influence an occurrence or occurrences of the same Feedback describes the situation when output from (or information about the result of) an event or phenomenon in the past will influence an occurrence or...
. In Cartesian coordinates, the real part of the transfer function is plotted on the X axis. The imaginary part is plotted on the Y axis. The frequency is swept as a parameter. Alternatively, in polar coordinates, the gain
Gain
In electronics, gain is a measure of the ability of a circuit to increase the power or amplitude of a signal from the input to the output. It is usually defined as the mean ratio of the signal output of a system to the signal input of the same system. It may also be defined on a logarithmic scale,...
of the transfer function is plotted as the radial coordinate, while the phase
Phase (waves)
Phase in waves is the fraction of a wave cycle which has elapsed relative to an arbitrary point.-Formula:The phase of an oscillation or wave refers to a sinusoidal function such as the following:...
of the transfer function is plotted as the angular coordinate. The Nyquist plot is named after Harry Nyquist
Harry Nyquist
Harry Nyquist was an important contributor to information theory.-Personal life:...
, a former engineer at Bell Laboratories.
Uses
Assessment of the stability of a closed-loop negative feedbackNegative feedback
Negative feedback occurs when the output of a system acts to oppose changes to the input of the system, with the result that the changes are attenuated. If the overall feedback of the system is negative, then the system will tend to be stable.- Overview :...
system is done by applying the Nyquist stability criterion
Nyquist stability criterion
When designing a feedback control system, it is generally necessary to determine whether the closed-loop system will be stable. An example of a destabilizing feedback control system would be a car steering system that overcompensates -- if the car drifts in one direction, the control system...
to the Nyquist plot of the open-loop system (i.e. the same system without its feedback loop). This method is easily applicable even for systems with delays and other non-rational transfer functions, which may appear difficult to analyze by means of other methods. Stability is determined by looking at the number of encirclements of the point at (-1,0). Range of gains over which the system will be stable can be determined by looking at crossing of the real axis.
The Nyquist plot can provide some information about the shape of the transfer function. For instance, the plot provides information on the difference between the number of poles and zero
Zero (complex analysis)
In complex analysis, a zero of a holomorphic function f is a complex number a such that f = 0.-Multiplicity of a zero:A complex number a is a simple zero of f, or a zero of multiplicity 1 of f, if f can be written asf=g\,where g is a holomorphic function g such that g is not zero.Generally, the...
s of the transfer function
Transfer function
A transfer function is a mathematical representation, in terms of spatial or temporal frequency, of the relation between the input and output of a linear time-invariant system. With optical imaging devices, for example, it is the Fourier transform of the point spread function i.e...
by the angle at which the curve approaches the origin.
When drawn by hand, a cartoon version of the Nyquist plot is sometimes used, which shows the shape of the curve, but where coordinates are distorted to show more detail in regions of interest. When plotted computationally, one needs to be careful to cover all frequencies of interest. This typically means that the parameter is swept logarithmically, in order to cover a wide range of values.