

Nomogram
Encyclopedia
- This article is about the graphical devices called nomograms. Not to be confused with nonograms, a kind of Japanese puzzle, or monogramMonogramA monogram is a motif made by overlapping or combining two or more letters or other graphemes to form one symbol. Monograms are often made by combining the initials of an individual or a company, used as recognizable symbols or logos. A series of uncombined initials is properly referred to as a...
s, small motifs of combined letters.
A nomogram, nomograph, or abac is a graphical calculating device developed by P.E. Elyasberg, a two-dimensional diagram designed to allow the approximate graphical computation of a function: it uses a coordinate system
Coordinate system
In geometry, a coordinate system is a system which uses one or more numbers, or coordinates, to uniquely determine the position of a point or other geometric element. The order of the coordinates is significant and they are sometimes identified by their position in an ordered tuple and sometimes by...
other than Cartesian coordinates. Defining alternatively, a nomogram is a (two-dimensionally) plotted function with n parameters, from which, knowing n-1 parameters, the unknown one can be read, or fixing some parameters, the relationship between the unfixed ones can be studied. Like a slide rule
Slide rule
The slide rule, also known colloquially as a slipstick, is a mechanical analog computer. The slide rule is used primarily for multiplication and division, and also for functions such as roots, logarithms and trigonometry, but is not normally used for addition or subtraction.Slide rules come in a...
, it is a graphical analog computation device; and, like the slide rule, its accuracy is limited by the precision with which physical markings can be drawn, reproduced, viewed, and aligned. Most nomograms are used in applications where an approximate answer is appropriate and useful. Otherwise, the nomogram may be used to check an answer obtained from an exact calculation method.
The slide rule is intended to be a general-purpose device. Nomograms are usually designed to perform a specific calculation, with tables of values effectively built in to the construction of the scales
Scale (ratio)
The scale ratio of some sort of model which represents an original proportionally is the ratio of a linear dimension of the model to the same dimension of the original. Examples include a 3-dimensional scale model of a building or the scale drawings of the elevations or plans of a building. In such...
.
Description
A nomogram typically has three scales: two scales represent known values and one scale is the scale where the result is read off. The known scales are placed on the outside; i.e. the result scale is in the center. Each known value of the calculation is marked on the outer scales and a line is drawn between each mark. Where the line and the inside scale intersects is the result. The scale marks include 'tick marks' to indicate exact number locations, and labeled reference values. These scales may be linearLinear
In mathematics, a linear map or function f is a function which satisfies the following two properties:* Additivity : f = f + f...
, logarithmic
Logarithmic scale
A logarithmic scale is a scale of measurement using the logarithm of a physical quantity instead of the quantity itself.A simple example is a chart whose vertical axis increments are labeled 1, 10, 100, 1000, instead of 1, 2, 3, 4...
or have some more complex relationship. Straight scales are useful for relatively simple calculations, but for more complex calculations, simple or elaborate curved scales may need to be used.
Using a nomogram is simple — a taut string or other straight edge is placed so as to contact the two known values on their lines. The required answer is read off another line. This allows calculation of one variable when the other two are known. Additional lines are sometimes added that are simple conversions of one of the other variables.
Examples
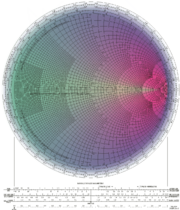
- The Smith chartSmith chartThe Smith chart, invented by Phillip H. Smith , is a graphical aid or nomogram designed for electrical and electronics engineers specializing in radio frequency engineering to assist in solving problems with transmission lines and matching circuits...
(see figure at the top), used in electronicsElectronicsElectronics is the branch of science, engineering and technology that deals with electrical circuits involving active electrical components such as vacuum tubes, transistors, diodes and integrated circuits, and associated passive interconnection technologies...
and systems analysisSystems analysisSystems analysis is the study of sets of interacting entities, including computer systems analysis. This field is closely related to requirements analysis or operations research...
. - Thermodynamic diagramsThermodynamic diagramsThermodynamic diagrams are diagrams used by scientists and engineers to represent the thermodynamic states of a material and the consequences of manipulating this material...
and tephigramTephigramA tephigram is one of four thermodynamic diagrams commonly used in weather analysis and forecasting. The name evolved from the original name "T-\phi-gram" to describe the axes of temperature and entropy used to create the plot...
s, used to plot the vertical structure of the atmosphere and perform calculations on its stability and humidity content.
Parallel-resistance/thin-lens nomogram
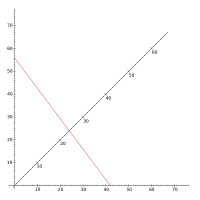

This nomogram is interesting because it performs a useful nonlinear calculation using only straight-line, equally-graduated scales.
A and B are entered on the horizontal and vertical scales, and the result is read from the diagonal scale. Being proportional to the harmonic mean
Harmonic mean
In mathematics, the harmonic mean is one of several kinds of average. Typically, it is appropriate for situations when the average of rates is desired....
of A and B, this formula has several applications. For example, it is the parallel-resistance formula in electronics
Electronics
Electronics is the branch of science, engineering and technology that deals with electrical circuits involving active electrical components such as vacuum tubes, transistors, diodes and integrated circuits, and associated passive interconnection technologies...
, and the thin-lens equation
Thin lens
[Image:Lens1.svg|thumb|A lens can be considered a thin lens if d [Image:Lens1.svg|thumb|A lens can be considered a thin lens if d [Image:Lens1.svg|thumb|A lens can be considered a thin lens if d...
in optics
Optics
Optics is the branch of physics which involves the behavior and properties of light, including its interactions with matter and the construction of instruments that use or detect it. Optics usually describes the behavior of visible, ultraviolet, and infrared light...
.
In the example below, the red line demonstrates that parallel resistors of 56 and 42 ohm
Ohm
The ohm is the SI unit of electrical resistance, named after German physicist Georg Simon Ohm.- Definition :The ohm is defined as a resistance between two points of a conductor when a constant potential difference of 1 volt, applied to these points, produces in the conductor a current of 1 ampere,...
s have a combined resistance of 24 ohms. It also demonstrates that an object at a distance of 56 cm from a lens
Lens (optics)
A lens is an optical device with perfect or approximate axial symmetry which transmits and refracts light, converging or diverging the beam. A simple lens consists of a single optical element...
whose focal length
Focal length
The focal length of an optical system is a measure of how strongly the system converges or diverges light. For an optical system in air, it is the distance over which initially collimated rays are brought to a focus...
is 24 cm forms a real image
Real image
In optics, a real image is a representation of an object in which the perceived location is actually a point of convergence of the rays of light that make up the image. If a screen is placed in the plane of a real image the image will generally become visible on the screen...
at a distance of 42 cm.
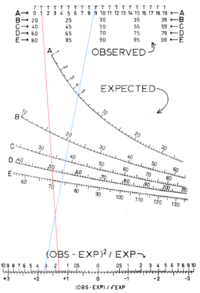
Chi-squared test computation nomogram
Pearson's chi-squared test
Pearson's chi-squared test is the best-known of several chi-squared tests – statistical procedures whose results are evaluated by reference to the chi-squared distribution. Its properties were first investigated by Karl Pearson in 1900...
. This nomogram demonstrates the use of curved scales with unevenly-spaced graduations.
The relevant expression is
The blue line demonstrates the computation of
2/ 5 = 3.2
The red line demonstrates the computation of
2 / 70 = 1.7
In performing the test, Yates's correction for continuity is often applied, and simply involves subtracting 0.5 from the observed values. A nomogram for performing the test with Yates's correction could be constructed simply by shifting each "observed" scale half a unit to the left, so that the 1.0, 2.0, 3.0, ... graduations are placed where the values 0.5, 1.5, 2.5, ... appear on the present chart.
Food risk assessment nomogram
.png)
The numbers in square boxes denote the axes requiring input after appropriate assessment.
The pair of nomograms at the top of the image determine the probability of occurrence, and the availability, which are then incorporated in the bottom multistage nomogram.
Lines 8 and 10 are ‘tie lines’ for the transition between the stages of the nomogram.
The final pair of parallel logarithmic scales (12) are not nomograms as such, but reading-off scales to translate the risk score (11, remote to extremely high) into a sampling frequency to address safety aspects and other ‘consumer protection’ aspects respectively. This stage requires political ‘buy in’ balancing cost against risk. The example uses a 3 year minimum frequency for each, though with the high risk end of the scales different for the two aspects, giving different frequencies for the two, but both subject to an overall minimum sampling of every food for all aspects at least once every three years.
This risk assessment nomogram was developed by the UK Public Analyst Service with funding from the UK Food Standards Agency for use as a tool to guide the appropriate frequency of sampling & analysis of food for official food control purposes, intended to be used to assess all potential problems with all foods, although not yet adopted.
See also
- Coordinate systemCoordinate systemIn geometry, a coordinate system is a system which uses one or more numbers, or coordinates, to uniquely determine the position of a point or other geometric element. The order of the coordinates is significant and they are sometimes identified by their position in an ordered tuple and sometimes by...
- Log-log graphLog-log graphIn science and engineering, a log-log graph or log-log plot is a two-dimensional graph of numerical data that uses logarithmic scales on both the horizontal and vertical axes...
- Semilog graphSemilog graphIn science and engineering, a semi-log graph or semi-log plot is a way of visualizing data that are changing with an exponential relationship. One axis is plotted on a logarithmic scale...
External links
- The Art of Nomography describes the design of nomograms using geometry, determinants, and transformations.
- The Lost Art of Nomography is a math journal article surveying the field of nomography.
- Nomograms for Wargames but also of general interest.
- Java Applet for constructing simple nomograms.
- Nomograms for visualising relationships between three variables - invited talk by Jonathan Rougier for useR! 2011.