
Multiple comparisons
Encyclopedia
In statistics
, the multiple comparisons or multiple testing problem occurs when one considers a set of statistical inference
s simultaneously. Errors in inference, including confidence interval
s that fail to include their corresponding population parameters or hypothesis tests that incorrectly reject the null hypothesis
are more likely to occur when one considers the set as a whole. Several statistical techniques have been developed to prevent this from happening, allowing significance levels for single and multiple comparisons to be directly compared. These techniques generally require a stronger level of evidence to be observed in order for an individual comparison to be deemed "significant", so as to compensate for the number of inferences being made.
In all three examples, as the number of comparisons increases, it becomes more likely that the groups being compared will appear to differ in terms of at least one attribute. However a difference between the groups is only meaningful if it generalizes to an independent sample of data (e.g. to an independent set of people treated with the same drug). Our confidence that a result will generalize to independent data should generally be weaker if it is observed as part of an analysis that involves multiple comparisons, rather than an analysis that involves only a single comparison.
To illustrate the issue in terms of confidence intervals, note that a single confidence interval with 95% coverage probability
level will likely contain the population parameter it is meant to contain, i.e. in the long run 95% of confidence intervals built in that way will contain the true population parameter. However, if one considers 100 confidence intervals simultaneously, with coverage probability 0.95 each, it is highly likely that at least one interval will not contain its population parameter. The expected number of such non-covering intervals is 5, and if the intervals are independent, the probability that at least one interval does not contain the population parameter is 99.4%.
If the inferences are hypothesis tests rather than confidence intervals, the same issue arises. With just one test performed at the 5% level, there is only a 5% chance of incorrectly rejecting the null hypothesis if the null hypothesis is true. However, for 100 tests where all null hypotheses are true, the expected number of incorrect rejections is 5. If the tests are independent, the probability of at least one incorrect rejection is 99.4%. These errors are called false positives.
Techniques have been developed to control the false positive error rate associated with performing multiple statistical tests. Similarly, techniques have been developed to adjust confidence intervals so that the probability of at least one of the intervals not covering its target value is controlled.
that the coin is fair, then the probability that a fair coin would come up heads at least 9 out of 10 times is (10 + 1) × (1/2)10 = 0.0107. This is relatively unlikely, and under statistical criteria
such as p-value
< 0.05, one would declare that the null hypothesis should be rejected — i.e., the coin is unfair.
A multiple-comparisons problem arises if one wanted to use this test (which is appropriate for testing the fairness of a single coin), to test the fairness of many coins. Imagine if one was to test 100 fair coins by this method. Given that the probability of a fair coin coming up 9 or 10 heads in 10 flips is 0.0107, one would expect that in flipping 100 fair coins ten times each, to see a particular (i.e., pre-selected) coin come up heads 9 or 10 times would still be very unlikely, but seeing any coin behave that way, without concern for which one, would be more likely than not. Precisely, the likelihood that all 100 fair coins are identified as fair by this criterion is (1 − 0.0107)100 ≈ 0.34. Therefore the application of our single-test coin-fairness criterion to multiple comparisons would be more likely to falsely identify at least one fair coin as unfair.
α, also termed FWER for familywise error rate
, is given by .
.
Hence, unless the tests are perfectly dependent, α increases as the number of comparisons increases.
If we do not assume that the comparisons are independent, then we can still say:
which follows from Boole's inequality
. Example:
You can use this result to assure that the familywise error rate is at most by setting
  . This highly conservative method is known as the Bonferroni correction
. A more sensitive correction can be obtained by solving the equation for the familywise error rate of independent comparisons for
  . This yields
  , which is known as the Šidák correction.
, and is one of the most commonly used approaches for multiple comparisons.
In some situations, the Bonferroni correction is substantially conservative, i.e., the actual familywise error rate is much less than the prescribed level α. This occurs when the test statistics are highly dependent (in the extreme case where the tests are perfectly dependent, the familywise error rate with no multiple comparisons adjustment and the per-test error rates are identical). For example, in fMRI analysis, tests are done on over 100000 voxel
s in the brain. The Bonferroni method would require p-values to be smaller than .05/100000 to declare significance. Since adjacent voxels tend to be highly correlated, this threshold is generally too stringent.
Because simple techniques such as the Bonferroni method can be too conservative, there has been a great deal of attention paid to developing better techniques, such that the overall rate of false positives can be maintained without inflating the rate of false negatives unnecessarily. Such methods can be divided into general categories:
The advent of computerized resampling
methods, such as bootstrapping
and Monte Carlo simulations, has given rise to many techniques in the latter category. In some cases where exhaustive permutation resampling is performed, these tests provide exact, strong control of Type I error rates; in other cases, such as bootstrap sampling, they provide only approximate control.
result, like the ANOVA F-test
. The significant ANOVA result suggests rejecting the global null hypothesis H0 that the means are the same across the groups being compared. Multiple comparison procedures are then used to determine which means differ. In a one-way ANOVA involving K group means, there are K(K − 1)/2 pairwise comparisons.
A number of methods have been proposed for this problem, some of which are:
Single-step procedures
Multi-step procedures based on Studentized range statistic
If the variances of the groups being compared are similar, the Tukey–Kramer method is generally viewed as performing optimally or near-optimally in a broad variety of circumstances. The situation where the variance of the groups being compared differ is more complex, and different methods perform well in different circumstances.
The Kruskal–Wallis test is the non-parametric alternative to ANOVA. Multiple comparisons can be done using pairwise comparisons (for example using Wilcoxon rank sum tests) and using a correction to determine if the post-hoc tests are significant (for example a Bonferroni correction
).
. A different set of techniques have been developed for "large-scale multiple testing," in which thousands or even greater numbers of tests are performed. For example, in genomics
, when using technologies such as microarray
s, expression levels of tens of thousands of genes can be measured, and genotypes for millions of genetic markers can be measured. Particularly in the field of genetic association
studies, there has been a serious problem with non-replication — a result being strongly statistically significant in one study but failing to be replicated in a follow-up study. Such non-replication can have many causes, but it is widely considered that failure to fully account for the consequences of making multiple comparisons is one of the causes.
In different branches of science, multiple testing is handled in different ways. It has been argued that if statistical tests are only performed when there is a strong basis for expecting the result to be true, multiple comparisons adjustments are not necessary. It has also been argued that use of multiple testing corrections is an inefficient way to perform empirical research
, since multiple testing adjustments control false positives at the potential expense of many more false negatives
. On the other hand, it has been argued that advances in measurement
and information technology
have made it far easier to generate large datasets for exploratory analysis
, often leading to the testing of large numbers of hypotheses with no prior basis for expecting many of the hypotheses to be true. In this situation, very high false positive rate
s are expected unless multiple comparisons adjustments are made.
For large-scale testing problems where the goal is to provide definitive results, the familywise error rate
remains the most accepted parameter for ascribing significance levels to statistical tests. Alternatively, if a study is viewed as exploratory, or if significant results can be easily re-tested in an independent study, control of the false discovery rate
(FDR) is often preferred. The FDR, defined as the expected proportion of false positives among all significant tests, allows researchers to identify a set of "candidate positives," of which a high proportion are likely to be true. The false positives within the candidate set can then be identified in a follow-up study.
 A basic question faced at the outset of analyzing a large set of testing results is whether there is evidence that any of the alternative hypotheses are true. One simple meta-test that can be applied when it is assumed that the tests are independent of each other is to use the Poisson distribution
as a model for the number of significant results at a given level α that would be found when all null hypotheses are true. If the observed number of positives is substantially greater than what should be expected, this suggests that there are likely to be some true positives among the significant results. For example, if 1000 independent tests are performed, each at level α = 0.05, we expect 50 significant tests to occur when all null hypotheses are true. Based on the Poisson distribution with mean 50, the probability of observing more than 61 significant tests is less than 0.05, so if we observe more than 61 significant results, it is very likely that some of them correspond to situations where the alternative hypothesis holds. A drawback of this approach is that it over-states the evidence that some of the alternative hypotheses are true when the test statistic
s are positively correlated, which commonly occurs in practice.
Another common approach that can be used in situations where the test statistics can be standardized to Z-scores
is to make a normal quantile plot
of the test statistics. If the observed quantiles are markedly more dispersed
than the normal quantiles, this suggests that some of the significant results may be true positives.
General methods of alpha adjustment for multiple comparisons
Statistics
Statistics is the study of the collection, organization, analysis, and interpretation of data. It deals with all aspects of this, including the planning of data collection in terms of the design of surveys and experiments....
, the multiple comparisons or multiple testing problem occurs when one considers a set of statistical inference
Statistical inference
In statistics, statistical inference is the process of drawing conclusions from data that are subject to random variation, for example, observational errors or sampling variation...
s simultaneously. Errors in inference, including confidence interval
Confidence interval
In statistics, a confidence interval is a particular kind of interval estimate of a population parameter and is used to indicate the reliability of an estimate. It is an observed interval , in principle different from sample to sample, that frequently includes the parameter of interest, if the...
s that fail to include their corresponding population parameters or hypothesis tests that incorrectly reject the null hypothesis
Null hypothesis
The practice of science involves formulating and testing hypotheses, assertions that are capable of being proven false using a test of observed data. The null hypothesis typically corresponds to a general or default position...
are more likely to occur when one considers the set as a whole. Several statistical techniques have been developed to prevent this from happening, allowing significance levels for single and multiple comparisons to be directly compared. These techniques generally require a stronger level of evidence to be observed in order for an individual comparison to be deemed "significant", so as to compensate for the number of inferences being made.
Practical examples
The term "comparisons" in multiple comparisons typically refers to comparisons of two groups, such as a treatment group and a control group. "Multiple comparisons" arise when a statistical analysis encompasses a number of formal comparisons, with the presumption that attention will focus on the strongest differences among all comparisons that are made. Failure to compensate for multiple comparisons can have important real-world consequences, as illustrated by the following examples.- Suppose the treatment is a new way of teaching writing to students, and the control is the standard way of teaching writing. Students in the two groups can be compared in terms of grammar, spelling, organization, content, and so on. As more attributes are compared, it becomes more likely that the treatment and control groups will appear to differ on at least one attribute.
- Suppose we consider the efficacy of a drugPharmacologyPharmacology is the branch of medicine and biology concerned with the study of drug action. More specifically, it is the study of the interactions that occur between a living organism and chemicals that affect normal or abnormal biochemical function...
in terms of the reduction of any one of a number of disease symptoms. As more symptoms are considered, it becomes more likely that the drug will appear to be an improvement over existing drugs in terms of at least one symptom.
- Suppose we consider the safety of a drug in terms of the occurrences of different types of side effects. As more types of side effects are considered, it becomes more likely that the new drug will appear to be less safe than existing drugs in terms of at least one side effect.
In all three examples, as the number of comparisons increases, it becomes more likely that the groups being compared will appear to differ in terms of at least one attribute. However a difference between the groups is only meaningful if it generalizes to an independent sample of data (e.g. to an independent set of people treated with the same drug). Our confidence that a result will generalize to independent data should generally be weaker if it is observed as part of an analysis that involves multiple comparisons, rather than an analysis that involves only a single comparison.
Confidence intervals and hypothesis tests
The family of statistical inferences that occur in a multiple comparisons analysis can comprise confidence intervals, hypothesis tests, or both in combination.To illustrate the issue in terms of confidence intervals, note that a single confidence interval with 95% coverage probability
Coverage probability
In statistics, the coverage probability of a confidence interval is the proportion of the time that the interval contains the true value of interest. For example, suppose our interest is in the mean number of months that people with a particular type of cancer remain in remission following...
level will likely contain the population parameter it is meant to contain, i.e. in the long run 95% of confidence intervals built in that way will contain the true population parameter. However, if one considers 100 confidence intervals simultaneously, with coverage probability 0.95 each, it is highly likely that at least one interval will not contain its population parameter. The expected number of such non-covering intervals is 5, and if the intervals are independent, the probability that at least one interval does not contain the population parameter is 99.4%.
If the inferences are hypothesis tests rather than confidence intervals, the same issue arises. With just one test performed at the 5% level, there is only a 5% chance of incorrectly rejecting the null hypothesis if the null hypothesis is true. However, for 100 tests where all null hypotheses are true, the expected number of incorrect rejections is 5. If the tests are independent, the probability of at least one incorrect rejection is 99.4%. These errors are called false positives.
Techniques have been developed to control the false positive error rate associated with performing multiple statistical tests. Similarly, techniques have been developed to adjust confidence intervals so that the probability of at least one of the intervals not covering its target value is controlled.
Example: Flipping coins
For example, one might declare that a coin was biased if in 10 flips it landed heads at least 9 times. Indeed, if one assumes as a null hypothesisNull hypothesis
The practice of science involves formulating and testing hypotheses, assertions that are capable of being proven false using a test of observed data. The null hypothesis typically corresponds to a general or default position...
that the coin is fair, then the probability that a fair coin would come up heads at least 9 out of 10 times is (10 + 1) × (1/2)10 = 0.0107. This is relatively unlikely, and under statistical criteria
Statistical significance
In statistics, a result is called statistically significant if it is unlikely to have occurred by chance. The phrase test of significance was coined by Ronald Fisher....
such as p-value
P-value
In statistical significance testing, the p-value is the probability of obtaining a test statistic at least as extreme as the one that was actually observed, assuming that the null hypothesis is true. One often "rejects the null hypothesis" when the p-value is less than the significance level α ,...
< 0.05, one would declare that the null hypothesis should be rejected — i.e., the coin is unfair.
A multiple-comparisons problem arises if one wanted to use this test (which is appropriate for testing the fairness of a single coin), to test the fairness of many coins. Imagine if one was to test 100 fair coins by this method. Given that the probability of a fair coin coming up 9 or 10 heads in 10 flips is 0.0107, one would expect that in flipping 100 fair coins ten times each, to see a particular (i.e., pre-selected) coin come up heads 9 or 10 times would still be very unlikely, but seeing any coin behave that way, without concern for which one, would be more likely than not. Precisely, the likelihood that all 100 fair coins are identified as fair by this criterion is (1 − 0.0107)100 ≈ 0.34. Therefore the application of our single-test coin-fairness criterion to multiple comparisons would be more likely to falsely identify at least one fair coin as unfair.
Formalism
For hypothesis testing, the problem of multiple comparisons (also known as the multiple testing problem) results from the increase in type I error that occurs when statistical tests are used repeatedly. If n independent comparisons are performed, the experiment-wide significance levelStatistical significance
In statistics, a result is called statistically significant if it is unlikely to have occurred by chance. The phrase test of significance was coined by Ronald Fisher....
α, also termed FWER for familywise error rate
Familywise error rate
In statistics, familywise error rate is the probability of making one or more false discoveries, or type I errors among all the hypotheses when performing multiple pairwise tests.-Classification of m hypothesis tests:...
, is given by
.Hence, unless the tests are perfectly dependent, α increases as the number of comparisons increases.
If we do not assume that the comparisons are independent, then we can still say:
which follows from Boole's inequality
Boole's inequality
In probability theory, Boole's inequality, also known as the union bound, says that for any finite or countable set of events, the probability that at least one of the events happens is no greater than the sum of the probabilities of the individual events...
. Example:
You can use this result to assure that the familywise error rate is at most
by setting . This highly conservative method is known as the Bonferroni correctionBonferroni correction
In statistics, the Bonferroni correction is a method used to counteract the problem of multiple comparisons. It was developed and introduced by Italian mathematician Carlo Emilio Bonferroni...
. A more sensitive correction can be obtained by solving the equation for the familywise error rate of
independent comparisons for . This yields , which is known as the Šidák correction.Methods
Multiple testing correction refers to re-calculating probabilities obtained from a statistical test which was repeated multiple times. In order to retain a prescribed familywise error rate α in an analysis involving more than one comparison, the error rate for each comparison must be more stringent than α. Boole's inequality implies that if each test is performed to have type I error rate α/n, the total error rate will not exceed α. This is called the Bonferroni correctionBonferroni correction
In statistics, the Bonferroni correction is a method used to counteract the problem of multiple comparisons. It was developed and introduced by Italian mathematician Carlo Emilio Bonferroni...
, and is one of the most commonly used approaches for multiple comparisons.
In some situations, the Bonferroni correction is substantially conservative, i.e., the actual familywise error rate is much less than the prescribed level α. This occurs when the test statistics are highly dependent (in the extreme case where the tests are perfectly dependent, the familywise error rate with no multiple comparisons adjustment and the per-test error rates are identical). For example, in fMRI analysis, tests are done on over 100000 voxel
Voxel
A voxel is a volume element, representing a value on a regular grid in three dimensional space. This is analogous to a pixel, which represents 2D image data in a bitmap...
s in the brain. The Bonferroni method would require p-values to be smaller than .05/100000 to declare significance. Since adjacent voxels tend to be highly correlated, this threshold is generally too stringent.
Because simple techniques such as the Bonferroni method can be too conservative, there has been a great deal of attention paid to developing better techniques, such that the overall rate of false positives can be maintained without inflating the rate of false negatives unnecessarily. Such methods can be divided into general categories:
- Methods where total alpha can be proved to never exceed 0.05 (or some other chosen value) under any conditions. These methods provide "strong" control against Type I error, in all conditions including a partially correct null hypothesis.
- Methods where total alpha can be proved not to exceed 0.05 except under certain defined conditions.
- Methods which rely on an omnibus testOmnibus testOmnibus tests are a kind of statistical test. They test whether the explained variance in a set of data is significantly greater than the unexplained variance, overall. One example is the F-test in the analysis of variance. There can be legitimate significant effects within a model even if the...
before proceeding to multiple comparisons. Typically these methods require a significant ANOVA/Tukey's range test before proceeding to multiple comparisons. These methods have "weak" control of Type I error. - Empirical methods, which control the proportion of Type I errors adaptively, utilizing correlation and distribution characteristics of the observed data.
The advent of computerized resampling
Resampling
Resampling may refer to:* Resampling , several related audio processes* Resampling , resampling methods in statistics* Resampling , scaling of bitmap images* Sample rate conversion-See also:* Downsampling* Upsampling...
methods, such as bootstrapping
Bootstrapping (statistics)
In statistics, bootstrapping is a computer-based method for assigning measures of accuracy to sample estimates . This technique allows estimation of the sample distribution of almost any statistic using only very simple methods...
and Monte Carlo simulations, has given rise to many techniques in the latter category. In some cases where exhaustive permutation resampling is performed, these tests provide exact, strong control of Type I error rates; in other cases, such as bootstrap sampling, they provide only approximate control.
Post-hoc testing of ANOVAs
Multiple comparison procedures are commonly used in an analysis of variance after obtaining a significant omnibus testOmnibus test
Omnibus tests are a kind of statistical test. They test whether the explained variance in a set of data is significantly greater than the unexplained variance, overall. One example is the F-test in the analysis of variance. There can be legitimate significant effects within a model even if the...
result, like the ANOVA F-test
F-test
An F-test is any statistical test in which the test statistic has an F-distribution under the null hypothesis.It is most often used when comparing statistical models that have been fit to a data set, in order to identify the model that best fits the population from which the data were sampled. ...
. The significant ANOVA result suggests rejecting the global null hypothesis H0 that the means are the same across the groups being compared. Multiple comparison procedures are then used to determine which means differ. In a one-way ANOVA involving K group means, there are K(K − 1)/2 pairwise comparisons.
A number of methods have been proposed for this problem, some of which are:
Single-step procedures
- Tukey–Kramer method (Tukey's HSD) (1951)
- Scheffe method (1953)
Multi-step procedures based on Studentized range statistic
- Duncan's new multiple range testDuncan's new multiple range testIn statistics, Duncan's new multiple range test is a multiple comparison procedure developed by David B. Duncan in 1955. Duncan's MRT belongs to the general class of multiple comparison procedures that use the studentized range statistic qr to compare sets of means.Duncan's new multiple range test...
(1955) - The Nemenyi testNemenyi testIn statistics, the Nemenyi test is a post-hoc test intended to find the groups of data that differ after a statistical test of multiple comparisons has rejected the null hypothesis that the performance of the comparisons on the groups of data is similar...
is similar to Tukey's range test in ANOVA.
- The Bonferroni–Dunn test allows comparisons, controlling the familywise error rate.
- Student Newman-KeulsNewman–Keuls methodIn statistics, the Newman–Keuls method is a post-hoc test used for comparisons after the performed F-test is found to be significant...
post-hoc analysisPost-hoc analysisPost-hoc analysis , in the context of design and analysis of experiments, refers to looking at the data—after the experiment has concluded—for patterns that were not specified a priori. It is sometimes called by critics data dredging to evoke the sense that the more one looks the more likely...
If the variances of the groups being compared are similar, the Tukey–Kramer method is generally viewed as performing optimally or near-optimally in a broad variety of circumstances. The situation where the variance of the groups being compared differ is more complex, and different methods perform well in different circumstances.
The Kruskal–Wallis test is the non-parametric alternative to ANOVA. Multiple comparisons can be done using pairwise comparisons (for example using Wilcoxon rank sum tests) and using a correction to determine if the post-hoc tests are significant (for example a Bonferroni correction
Bonferroni correction
In statistics, the Bonferroni correction is a method used to counteract the problem of multiple comparisons. It was developed and introduced by Italian mathematician Carlo Emilio Bonferroni...
).
Large-scale multiple testing
Traditional methods for multiple comparisons adjustments focus on correcting for modest numbers of comparisons, often in an analysis of varianceAnalysis of variance
In statistics, analysis of variance is a collection of statistical models, and their associated procedures, in which the observed variance in a particular variable is partitioned into components attributable to different sources of variation...
. A different set of techniques have been developed for "large-scale multiple testing," in which thousands or even greater numbers of tests are performed. For example, in genomics
Genomics
Genomics is a discipline in genetics concerning the study of the genomes of organisms. The field includes intensive efforts to determine the entire DNA sequence of organisms and fine-scale genetic mapping efforts. The field also includes studies of intragenomic phenomena such as heterosis,...
, when using technologies such as microarray
DNA microarray
A DNA microarray is a collection of microscopic DNA spots attached to a solid surface. Scientists use DNA microarrays to measure the expression levels of large numbers of genes simultaneously or to genotype multiple regions of a genome...
s, expression levels of tens of thousands of genes can be measured, and genotypes for millions of genetic markers can be measured. Particularly in the field of genetic association
Genetic association
Genetic association is the occurrence, more often than can be readily explained by chance, of two or more traits in a population of individuals, of which at least one trait is known to be genetic....
studies, there has been a serious problem with non-replication — a result being strongly statistically significant in one study but failing to be replicated in a follow-up study. Such non-replication can have many causes, but it is widely considered that failure to fully account for the consequences of making multiple comparisons is one of the causes.
In different branches of science, multiple testing is handled in different ways. It has been argued that if statistical tests are only performed when there is a strong basis for expecting the result to be true, multiple comparisons adjustments are not necessary. It has also been argued that use of multiple testing corrections is an inefficient way to perform empirical research
Empirical research
Empirical research is a way of gaining knowledge by means of direct and indirect observation or experience. Empirical evidence can be analyzed quantitatively or qualitatively...
, since multiple testing adjustments control false positives at the potential expense of many more false negatives
Type I and type II errors
In statistical test theory the notion of statistical error is an integral part of hypothesis testing. The test requires an unambiguous statement of a null hypothesis, which usually corresponds to a default "state of nature", for example "this person is healthy", "this accused is not guilty" or...
. On the other hand, it has been argued that advances in measurement
Measurement
Measurement is the process or the result of determining the ratio of a physical quantity, such as a length, time, temperature etc., to a unit of measurement, such as the metre, second or degree Celsius...
and information technology
Information technology
Information technology is the acquisition, processing, storage and dissemination of vocal, pictorial, textual and numerical information by a microelectronics-based combination of computing and telecommunications...
have made it far easier to generate large datasets for exploratory analysis
Exploratory data analysis
In statistics, exploratory data analysis is an approach to analysing data sets to summarize their main characteristics in easy-to-understand form, often with visual graphs, without using a statistical model or having formulated a hypothesis...
, often leading to the testing of large numbers of hypotheses with no prior basis for expecting many of the hypotheses to be true. In this situation, very high false positive rate
False positive rate
When performing multiple comparisons in a statistical analysis, the false positive rate is the probability of falsely rejecting the null hypothesis for a particular test among all the tests performed...
s are expected unless multiple comparisons adjustments are made.
For large-scale testing problems where the goal is to provide definitive results, the familywise error rate
Familywise error rate
In statistics, familywise error rate is the probability of making one or more false discoveries, or type I errors among all the hypotheses when performing multiple pairwise tests.-Classification of m hypothesis tests:...
remains the most accepted parameter for ascribing significance levels to statistical tests. Alternatively, if a study is viewed as exploratory, or if significant results can be easily re-tested in an independent study, control of the false discovery rate
False discovery rate
False discovery rate control is a statistical method used in multiple hypothesis testing to correct for multiple comparisons. In a list of rejected hypotheses, FDR controls the expected proportion of incorrectly rejected null hypotheses...
(FDR) is often preferred. The FDR, defined as the expected proportion of false positives among all significant tests, allows researchers to identify a set of "candidate positives," of which a high proportion are likely to be true. The false positives within the candidate set can then be identified in a follow-up study.
Assessing whether any alternative hypotheses are true
Poisson distribution
In probability theory and statistics, the Poisson distribution is a discrete probability distribution that expresses the probability of a given number of events occurring in a fixed interval of time and/or space if these events occur with a known average rate and independently of the time since...
as a model for the number of significant results at a given level α that would be found when all null hypotheses are true. If the observed number of positives is substantially greater than what should be expected, this suggests that there are likely to be some true positives among the significant results. For example, if 1000 independent tests are performed, each at level α = 0.05, we expect 50 significant tests to occur when all null hypotheses are true. Based on the Poisson distribution with mean 50, the probability of observing more than 61 significant tests is less than 0.05, so if we observe more than 61 significant results, it is very likely that some of them correspond to situations where the alternative hypothesis holds. A drawback of this approach is that it over-states the evidence that some of the alternative hypotheses are true when the test statistic
Test statistic
In statistical hypothesis testing, a hypothesis test is typically specified in terms of a test statistic, which is a function of the sample; it is considered as a numerical summary of a set of data that...
s are positively correlated, which commonly occurs in practice.
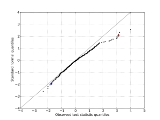
Another common approach that can be used in situations where the test statistics can be standardized to Z-scores
Standard score
In statistics, a standard score indicates how many standard deviations an observation or datum is above or below the mean. It is a dimensionless quantity derived by subtracting the population mean from an individual raw score and then dividing the difference by the population standard deviation...
is to make a normal quantile plot
Q-Q plot
In statistics, a Q-Q plot is a probability plot, which is a graphical method for comparing two probability distributions by plotting their quantiles against each other. First, the set of intervals for the quantiles are chosen...
of the test statistics. If the observed quantiles are markedly more dispersed
Statistical dispersion
In statistics, statistical dispersion is variability or spread in a variable or a probability distribution...
than the normal quantiles, this suggests that some of the significant results may be true positives.
See also
Key concepts- Familywise error rateFamilywise error rateIn statistics, familywise error rate is the probability of making one or more false discoveries, or type I errors among all the hypotheses when performing multiple pairwise tests.-Classification of m hypothesis tests:...
- False positive rateFalse positive rateWhen performing multiple comparisons in a statistical analysis, the false positive rate is the probability of falsely rejecting the null hypothesis for a particular test among all the tests performed...
- False discovery rateFalse discovery rateFalse discovery rate control is a statistical method used in multiple hypothesis testing to correct for multiple comparisons. In a list of rejected hypotheses, FDR controls the expected proportion of incorrectly rejected null hypotheses...
(FDR) - Post-hoc analysisPost-hoc analysisPost-hoc analysis , in the context of design and analysis of experiments, refers to looking at the data—after the experiment has concluded—for patterns that were not specified a priori. It is sometimes called by critics data dredging to evoke the sense that the more one looks the more likely...
- Experimentwise error rateExperimentwise error rateIn statistics, during multiple comparisons testing, experimentwise error rate is the probability of at least one false rejection of the null hypothesis over an entire experiment. The α that is assigned applies to all of the hypothesis tests as a whole, not individually as in the comparisonwise...
General methods of alpha adjustment for multiple comparisons
- Closed testing procedureClosed testing procedureIn statistics, the closed testing procedure is a general method for performing more than one hypothesis test simultaneously.-The closed testing principle:...
- Bonferroni correctionBonferroni correctionIn statistics, the Bonferroni correction is a method used to counteract the problem of multiple comparisons. It was developed and introduced by Italian mathematician Carlo Emilio Bonferroni...
- Boole–Bonferroni bound
- Holm–Bonferroni method
- Westfall–Young step-down approach of Westfall and Young
- method of Benjamini and Hochberg
- Testing hypotheses suggested by the dataTesting hypotheses suggested by the dataIn statistics, hypotheses suggested by the data, if tested using the data set that suggested them, are likely to be accepted even when they are not true...