

Mathematical diagram
Encyclopedia
Diagram
A diagram is a two-dimensional geometric symbolic representation of information according to some visualization technique. Sometimes, the technique uses a three-dimensional visualization which is then projected onto the two-dimensional surface...
s in the field of mathematics
Mathematics
Mathematics is the study of quantity, space, structure, and change. Mathematicians seek out patterns and formulate new conjectures. Mathematicians resolve the truth or falsity of conjectures by mathematical proofs, which are arguments sufficient to convince other mathematicians of their validity...
, and diagrams using mathematics such as chart
Chart
A chart is a graphical representation of data, in which "the data is represented by symbols, such as bars in a bar chart, lines in a line chart, or slices in a pie chart"...
s and graphs
Graphics
Graphics are visual presentations on some surface, such as a wall, canvas, computer screen, paper, or stone to brand, inform, illustrate, or entertain. Examples are photographs, drawings, Line Art, graphs, diagrams, typography, numbers, symbols, geometric designs, maps, engineering drawings,or...
, that are mainly designed to convey mathematical relationships, for example, comparisons over time.
Argand diagram
Complex number
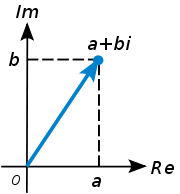
A complex number is a number consisting of a real part and an imaginary part. Complex numbers extend the idea of the one-dimensional number line to the two-dimensional complex plane by using the number line for the real part and adding a vertical axis to plot the imaginary part...
can be visually represented as a pair of numbers forming a vector on a diagram called an Argand diagram
The complex plane
Complex plane
In mathematics, the complex plane or z-plane is a geometric representation of the complex numbers established by the real axis and the orthogonal imaginary axis...
is sometimes called the Argand plane because it is used in Argand diagrams. These are named after Jean-Robert Argand
Jean-Robert Argand
Jean-Robert Argand was a gifted amateur mathematician. In 1806, while managing a bookstore in Paris, he published the idea of geometrical interpretation of complex numbers known as the Argand diagram.-Life:...
(1768–1822), although they were first described by Norwegian-Danish land surveyor and mathematician Caspar Wessel
Caspar Wessel
Caspar Wessel was a Norwegian-Danish mathematician and cartographer. In 1799, Wessel was the first person to describe the complex numbers. He was the younger brother of poet and playwright Johan Herman Wessel....
(1745–1818). Argand diagrams are frequently used to plot the positions of the poles and zeroes of a function in the complex plane.
The concept of the complex plane allows a geometric interpretation of complex numbers. Under addition
Addition
Addition is a mathematical operation that represents combining collections of objects together into a larger collection. It is signified by the plus sign . For example, in the picture on the right, there are 3 + 2 apples—meaning three apples and two other apples—which is the same as five apples....
, they add like vector
Vector (spatial)
In elementary mathematics, physics, and engineering, a Euclidean vector is a geometric object that has both a magnitude and direction...
s. The multiplication
Multiplication
Multiplication is the mathematical operation of scaling one number by another. It is one of the four basic operations in elementary arithmetic ....
of two complex numbers can be expressed most easily in polar coordinates – the magnitude or modulus of the product is the product of the two absolute value
Absolute value
In mathematics, the absolute value |a| of a real number a is the numerical value of a without regard to its sign. So, for example, the absolute value of 3 is 3, and the absolute value of -3 is also 3...
s, or moduli, and the angle or argument of the product is the sum of the two angles, or arguments. In particular, multiplication by a complex number of modulus 1 acts as a rotation.
Butterfly diagram
In the context of fast Fourier transformFast Fourier transform
A fast Fourier transform is an efficient algorithm to compute the discrete Fourier transform and its inverse. "The FFT has been called the most important numerical algorithm of our lifetime ." There are many distinct FFT algorithms involving a wide range of mathematics, from simple...
algorithms, a butterfly
Butterfly diagram
In the context of fast Fourier transform algorithms, a butterfly is a portion of the computation that combines the results of smaller discrete Fourier transforms into a larger DFT, or vice versa . The name "butterfly" comes from the shape of the data-flow diagram in the radix-2 case, as described...
is a portion of the computation that combines the results of smaller discrete Fourier transform
Discrete Fourier transform
In mathematics, the discrete Fourier transform is a specific kind of discrete transform, used in Fourier analysis. It transforms one function into another, which is called the frequency domain representation, or simply the DFT, of the original function...
s (DFTs) into a larger DFT, or vice versa (breaking a larger DFT up into subtransforms). The name "butterfly" comes from the shape of the data-flow diagram in the radix-2 case, as described below. The same structure can also be found in the Viterbi algorithm
Viterbi algorithm
The Viterbi algorithm is a dynamic programming algorithm for finding the most likely sequence of hidden states – called the Viterbi path – that results in a sequence of observed events, especially in the context of Markov information sources, and more generally, hidden Markov models...
, used for finding the most likely sequence of hidden states.
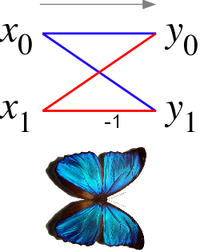
The butterfly diagram
Butterfly diagram
In the context of fast Fourier transform algorithms, a butterfly is a portion of the computation that combines the results of smaller discrete Fourier transforms into a larger DFT, or vice versa . The name "butterfly" comes from the shape of the data-flow diagram in the radix-2 case, as described...
show a data-flow diagram connecting the inputs x (left) to the outputs y that depend on them (right) for a "butterfly" step of a radix-2 Cooley-Tukey FFT. This diagram resembles a butterfly
Butterfly
A butterfly is a mainly day-flying insect of the order Lepidoptera, which includes the butterflies and moths. Like other holometabolous insects, the butterfly's life cycle consists of four parts: egg, larva, pupa and adult. Most species are diurnal. Butterflies have large, often brightly coloured...
as in the Morpho butterfly
Morpho (butterfly)
A Morpho butterfly may be one of over 80 species of butterflies in the genus Morpho. They are Neotropical butterflies found mostly in South America as well as Mexico and Central America. Morphos range in wingspan from the 7.5 cm M. rhodopteron to the imposing 20 cm Sunset Morpho, M....
shown for comparison), hence the name.

Commutative diagram
In mathematics, and especially in category theory a commutative diagramCommutative diagram
In mathematics, and especially in category theory, a commutative diagram is a diagram of objects and morphisms such that all directed paths in the diagram with the same start and endpoints lead to the same result by composition...
is a diagram of objects, also known as vertices, and morphisms, also known as arrows or edges, such that when selecting two objects any directed path through the diagram leads to the same result by composition.
Commutative diagrams play the role in category theory that equations play in algebra.

Hasse diagrams
A Hasse diagramHasse diagram
In order theory, a branch of mathematics, a Hasse diagram is a type of mathematical diagram used to represent a finite partially ordered set, in the form of a drawing of its transitive reduction...
is a simple picture of a finite partially ordered set
Partially ordered set
In mathematics, especially order theory, a partially ordered set formalizes and generalizes the intuitive concept of an ordering, sequencing, or arrangement of the elements of a set. A poset consists of a set together with a binary relation that indicates that, for certain pairs of elements in the...
, forming a drawing
Graph drawing
Graph drawing is an area of mathematics and computer science combining methods from geometric graph theory and information visualization to derive two-dimensional depictions of graphs arising from applications such as social network analysis, cartography, and bioinformatics...
of the transitive reduction
Transitive reduction
In mathematics, a transitive reduction of a binary relation R on a set X is a minimal relation R' on X such that the transitive closure of R' is the same as the transitive closure of R. If the transitive closure of R is antisymmetric and finite, then R' is unique...
of the partial order. Concretely, one represents each element of S as a vertex on the page and draws a line segment or curve that goes upward from x to y if x < y, and there is no z such that x < z < y. In this case, we say y covers x, or y is an immediate successor of x. Furthermore it is required that the vertices are positioned in such a way that each curve meets exactly two vertices: its two endpoints. Any such diagram (given that the vertices are labeled) uniquely determines a partial order, and any partial order has a unique transitive reduction, but there are many possible placements of elements in the plane, resulting in different Hasse diagrams for a given order that may have widely varying appearances.

Knot diagrams
In Knot theoryKnot theory
In topology, knot theory is the study of mathematical knots. While inspired by knots which appear in daily life in shoelaces and rope, a mathematician's knot differs in that the ends are joined together so that it cannot be undone. In precise mathematical language, a knot is an embedding of a...
a useful way to visualise and manipulate knots is to project the knot onto a plane—think of the knot casting a shadow on the wall. A small perturbation in the choice of projection will ensure that it is one-to-one
Injective function
In mathematics, an injective function is a function that preserves distinctness: it never maps distinct elements of its domain to the same element of its codomain. In other words, every element of the function's codomain is mapped to by at most one element of its domain...
except at the double points, called crossings, where the "shadow" of the knot crosses itself once transversely
At each crossing we must indicate which section is "over" and which is "under", so as to be able to recreate the original knot. This is often done by creating a break in the strand going underneath. If by following the diagram the knot alternately crosses itself "over" and "under", then the diagram represents a particularly well-studied class of knot, alternating knot
Alternating knot
In knot theory, a link diagram is alternating if the crossings alternate under, over, under, over, as you travel along each component of the link. A link is alternating if it has an alternating diagram....
s.
Venn diagram
A Venn diagramVenn diagram
Venn diagrams or set diagrams are diagrams that show all possible logical relations between a finite collection of sets . Venn diagrams were conceived around 1880 by John Venn...
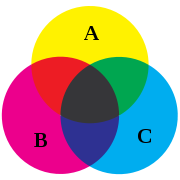
is a representation of mathematical sets: a mathematical diagram representing sets as circles, with their relationships to each other expressed through their overlapping positions, so that all possible relationships between the sets are shown.
The Venn diagram is constructed with a collection of simple closed curves drawn in the plane. The principle of these diagrams is that classes be represented by regions in such relation to one another that all the possible logical relations of these classes can be indicated in the same diagram. That is, the diagram initially leaves room for any possible relation of the classes, and the actual or given relation, can then be specified by indicating that some particular region is null or is notnull.
Voronoi diagram
A Voronoi diagramVoronoi diagram
In mathematics, a Voronoi diagram is a special kind of decomposition of a given space, e.g., a metric space, determined by distances to a specified family of objects in the space...
is a special kind of decomposition of a metric space
Metric space
In mathematics, a metric space is a set where a notion of distance between elements of the set is defined.The metric space which most closely corresponds to our intuitive understanding of space is the 3-dimensional Euclidean space...
determined by distances to a specified discrete set of objects in the space, e.g., by a discrete set of points. This diagram is named after Georgy Voronoi, also called a Voronoi tessellation
Tessellation
A tessellation or tiling of the plane is a pattern of plane figures that fills the plane with no overlaps and no gaps. One may also speak of tessellations of parts of the plane or of other surfaces. Generalizations to higher dimensions are also possible. Tessellations frequently appeared in the art...
, a Voronoi decomposition, or a Dirichlet tessellation after Lejeune Dirichlet.
In the simplest case, we are given a set of points S in the plane, which are the Voronoi sites. Each site s has a Voronoi cell V(s) consisting of all points closer to s than to any other site. The segments of the Voronoi diagram are all the points in the plane that are equidistant to two sites. The Voronoi nodes are the points equidistant to three (or more) sites
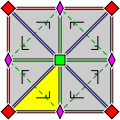
Wallpaper group diagrams
A wallpaper groupWallpaper group
A wallpaper group is a mathematical classification of a two-dimensional repetitive pattern, based on the symmetries in the pattern. Such patterns occur frequently in architecture and decorative art...
or plane symmetry group or plane crystallographic group is a mathematical classification of a two-dimensional repetitive pattern, based on the symmetries in the pattern. Such patterns occur frequently in architecture and decorative art. There are 17 possible distinct groups
Group (mathematics)
In mathematics, a group is an algebraic structure consisting of a set together with an operation that combines any two of its elements to form a third element. To qualify as a group, the set and the operation must satisfy a few conditions called group axioms, namely closure, associativity, identity...
.
Wallpaper groups are two-dimensional symmetry groups, intermediate in complexity between the simpler frieze group
Frieze group
A frieze group is a mathematical concept to classify designs on two-dimensional surfaces which are repetitive in one direction, based on the symmetries in the pattern. Such patterns occur frequently in architecture and decorative art...
s and the three-dimensional crystallographic groups, also called space group
Space group
In mathematics and geometry, a space group is a symmetry group, usually for three dimensions, that divides space into discrete repeatable domains.In three dimensions, there are 219 unique types, or counted as 230 if chiral copies are considered distinct...
s. Wallpaper groups categorize patterns by their symmetries. Subtle differences may place similar patterns in different groups, while patterns which are very different in style, color, scale or orientation may belong to the same group.
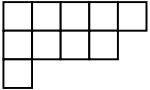
Young diagram
A Young diagram or Young tableauYoung tableau
In mathematics, a Young tableau is a combinatorial object useful in representation theory. It provides a convenient way to describe the group representations of the symmetric and general linear groups and to study their properties. Young tableaux were introduced by Alfred Young, a mathematician at...
, also called Ferrers diagram, is a finite collection of boxes, or cells, arranged in left-justified rows, with the row sizes weakly decreasing (each row has the same or shorter length than its predecessor).
Partition (number theory)
In number theory and combinatorics, a partition of a positive integer n, also called an integer partition, is a way of writing n as a sum of positive integers. Two sums that differ only in the order of their summands are considered to be the same partition; if order matters then the sum becomes a...
 of a positive integer n, the total number of boxes of the diagram. The Young diagram is said to be of shape
  , and it carries the same information as that partition. Listing the number of boxes in each column gives another partition, the conjugate or transpose partition of
  ; one obtains a Young diagram of that shape by reflecting the original diagram along its main diagonal.
Young tableaux were introduced by Alfred Young
Alfred Young
Alfred Young, FRS was a British mathematician.He was born in Widnes, Lancashire, England and educated at Monkton Combe School in Somerset and Clare College, Cambridge, graduating BA as 10th Wrangler in 1895. He is known for his work in the area of group theory...
, a mathematician
Mathematician
A mathematician is a person whose primary area of study is the field of mathematics. Mathematicians are concerned with quantity, structure, space, and change....
at Cambridge University
University of Cambridge
The University of Cambridge is a public research university located in Cambridge, United Kingdom. It is the second-oldest university in both the United Kingdom and the English-speaking world , and the seventh-oldest globally...
, in 1900. They were then applied to the study of symmetric group by Georg Frobenius in 1903. Their theory was further developed by many mathematicians.
Other mathematical diagrams
- Cremona diagramCremona diagramThe Cremona diagram is a graphical method used in statics of trusses to determine the forces in members . The method was created by the Italian mathematician Luigi Cremona....
- De Finetti diagramDe Finetti diagramA de Finetti diagram is a ternary plot used in population genetics. It is named after the Italian statistician Bruno de Finetti and is used to graph the genotype frequencies of populations, where there are two alleles and the population is diploid...
- Dynkin diagramRoot systemIn mathematics, a root system is a configuration of vectors in a Euclidean space satisfying certain geometrical properties. The concept is fundamental in the theory of Lie groups and Lie algebras...
- Stellation diagramStellation diagramIn geometry, a stellation diagram or stellation pattern is a two-dimensional diagram in the plane of some face of a polyhedron, showing lines where other face planes intersect with this one. The lines cause 2D space to be divided up into regions. Regions not intersected by any further lines are...
- Ulam spiralUlam spiralThe Ulam spiral, or prime spiral is a simple method of visualizing the prime numbers that reveals the apparent tendency of certain quadratic polynomials to generate unusually large numbers of primes...
- Van Kampen diagramVan Kampen diagramIn the mathematical area of geometric group theory, a van Kampen diagram is a planar diagram used to represent the fact that a particular word in the generators of a group given by a group presentation represents the identity element in that group.-History:...
See also
- Category theoryCategory theoryCategory theory is an area of study in mathematics that examines in an abstract way the properties of particular mathematical concepts, by formalising them as collections of objects and arrows , where these collections satisfy certain basic conditions...
- Logic diagram
- Mathematical jargonMathematical jargonThe language of mathematics has a vast vocabulary of specialist and technical terms. It also has a certain amount of jargon: commonly used phrases which are part of the culture of mathematics, rather than of the subject. Jargon often appears in lectures, and sometimes in print, as informal...
- Mathematical modelMathematical modelA mathematical model is a description of a system using mathematical concepts and language. The process of developing a mathematical model is termed mathematical modeling. Mathematical models are used not only in the natural sciences and engineering disciplines A mathematical model is a...
- Mathematics as a languageMathematics as a languageThe language of mathematics is the system used by mathematicians to communicate mathematical ideas among themselves. This language consists of a substrate of some natural language using technical terms and grammatical conventions that are peculiar to mathematical discourse , supplemented by a...
- Statistical modelStatistical modelA statistical model is a formalization of relationships between variables in the form of mathematical equations. A statistical model describes how one or more random variables are related to one or more random variables. The model is statistical as the variables are not deterministically but...
Further reading
- D. Barker-Plummer & S. Bailin (1997). "The Role of Diagrams in Mathematical Proofs". In: Machine GRAPHICS and VISION. 6(1): 25–56. (Special Issue on Diagrammatic Representation and Reasoning).
- D. Barker-Plummer & S.C. Bailin (2001). "On the practical semantics of mathematical diagrams". In: M. Anderson (ed.). Reasoning with Diagrammatic Representations. Springer Verlag.
- Kidman, G. (2002). "The Accuracy of mathematical diagrams in curriculum materials". In: Cockburn A and Nardi E. (Eds) Proceeding of the PME 26 Vol.3 201–208. UK:University of East Anglia.
- Zenon Kulpa (2004). "On Diagrammatic Representation of Mathematical Knowledge". In: Mathematical Knowledge Management, Andrea Asperti, Grzegorz Bancerek & Andrzej Trybulec (eds.). pp. 190–204.
- K. Puphaiboon, A. Woodcock & S. Scrivener (2005). "Design method for developing mathematical diagrams". In: Contemporary ergonomics 2005 Proceedings of the International Conference on Contemporary Ergonomics (CE2005), 5–7 April 2005 Hatfield, UK. Philip D. Bust (ed.). Taylor & Francis.
External links
- Diagrams, The Stanford Encyclopedia of Philosophy, Fall 2008.
- Diagrammatics: The art of thinking with diagrams by Zenon Kulpa
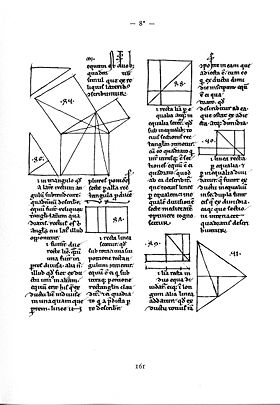
- One of the oldest extant diagrams from Euclid by Otto Neugebauer
- Diagrams in Mathematical Education: A Philosophical Appraisal, Dennis Lomas 1998.