

Logistic map
Encyclopedia
The logistic map is a polynomial
mapping
(equivalently, recurrence relation
) of degree 2
, often cited as an archetypal example of how complex, chaotic
behaviour can arise from very simple non-linear dynamical equations. The map was popularized in a seminal 1976 paper by the biologist Robert May
, in part as a discrete-time demographic model analogous to the logistic equation first created by Pierre François Verhulst
.
Mathematically, the logistic map is written
where: is a number between zero and one, and represents the ratio of existing population to the maximum possible population at year n, and hence x0 represents the initial ratio of population to max. population (at year 0)
This nonlinear difference equation is intended to capture two effects.
However, as a demographic model the logistic map has the pathological problem that some initial conditions and parameter values lead to negative population sizes. This problem does not appear in the older Ricker model
, which also exhibits chaotic dynamics.
The r=4 case of the logistic map is a nonlinear transformation of both the bit shift map and the case of the tent map.
For any value of r there is at most one stable cycle. A stable cycle attracts almost all points. For an r with a stable cycle of some period, there can be infinitely many unstable cycles of various periods.
A bifurcation diagram
summarizes this. The horizontal axis shows the values of the parameter r while the vertical axis shows the possible long-term values of x.
The bifurcation diagram is a fractal
: if you zoom in on the above mentioned value r = 3.82 and focus on one arm of the three, the situation nearby looks like a shrunk and slightly distorted version of the whole diagram. The same is true for all other non-chaotic points. This is an example of the deep and ubiquitous connection between chaos and fractals.
 The relative simplicity of the logistic map makes it an excellent point of entry into a consideration of the concept of chaos. A rough description of chaos is that chaotic systems exhibit a great sensitivity to initial conditions—a property of the logistic map for most values of r between about 3.57 and 4 (as noted above). A common source of such sensitivity to initial conditions is that the map represents a repeated folding and stretching of the space on which it is defined. In the case of the logistic map, the quadratic
difference equation (1) describing it may be thought of as a stretching-and-folding operation on the interval (0,1).
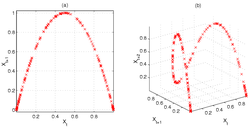
The following figure illustrates the stretching and folding over a sequence of iterates of the map. Figure (a), left, gives a two-dimensional phase
diagram of the logistic map for r=4, and clearly shows the quadratic curve of the difference equation (1). However, we can embed
the same sequence in a three-dimensional phase space, in order to investigate the deeper structure of the map. Figure (b), right, demonstrates this, showing how initially nearby points begin to diverge, particularly in those regions of Xt corresponding to the steeper sections of the plot.
This stretching-and-folding does not just produce a gradual divergence of the sequences of iterates, but an exponential divergence (see Lyapunov exponent
s), evidenced also by the complexity
and unpredictability of the chaotic logistic map. In fact, exponential divergence of sequences of iterates explains the connection between chaos and unpredictability: a small error in the supposed initial state of the system will tend to correspond to a large error later in its evolution. Hence, predictions about future states become progressively (indeed, exponentially
) worse when there are even very small errors in our knowledge of the initial state.
Since the map is confined to an interval on the real number line, its dimension is less than or equal to unity. Numerical estimates yield a correlation dimension
of 0.500 ± 0.005 (Grassberger
, 1983), a Hausdorff dimension
of about 0.538 (Grassberger
1981), and an information dimension of 0.5170976... (Grassberger
1983) for r=3.5699456... (onset of chaos). Note: It can be shown that the correlation dimension is certainly between 0.4926 and 0.5024.
It is often possible, however, to make precise and accurate statements about the likelihood of a future state in a chaotic system. If a (possibly chaotic) dynamical system
has an attractor
, then there exists a probability measure
that gives the long-run proportion of time spent by the system in the various regions of the attractor. In the case of the logistic map with parameter r = 4 and an initial state in (0,1), the attractor is also the interval (0,1) and the probability measure corresponds to the beta distribution with parameters a = 0.5 and b = 0.5. Specifically, the invariant measure is . Unpredictability is not randomness, but in some circumstances looks very much like it. Hence, and fortunately, even if we know very little about the initial state of the logistic map (or some other chaotic system), we can still say something about the distribution of states a long time into the future, and use this knowledge to inform decision
s based on the state of the system.
The solution when r = 4 is,

where the initial condition parameter is given by
  . For rational
  , after a finite number of iterations
  maps into a periodic sequence. But almost all
  are irrational, and for irrational
 never repeats itself – it is non-periodic. This solution equation clearly demonstrates the two key features of chaos – stretching and folding: the factor 2n shows the exponential growth of stretching, which results in sensitive dependence on initial conditions, while the squared sine function keeps
  folded within the range [0, 1].
By contrast, the solution when r=2 is

for . Since
  for any value of
  other than the unstable fixed point 0, the term
  goes to 0 as n goes to infinity, so
  goes to the stable fixed point
(also known as the bit-shift map) to find cycles of any length. If x follows the logistic map and y follows the dyadic transformation
then the two are related by
 .
.
The reason that the dyadic transformation is also called the bit-shift map is that when y is written in binary notation, the map moves the binary point one place to the right (and if the bit to the left of the binary point has become a "1", this "1" is changed to a "0"). A cycle of length 3, for example, occurs if an iterate has a 3-bit repeating sequence in its binary expansion (which is not also a one-bit repeating sequence): 001, 010, 100, 110, 101, or 011. The iterate 001001001... maps into 010010010..., which maps into 100100100..., which in turn maps into the original 001001001...; so this is a 3-cycle of the bit shift map. And the other three binary-expansion repeating sequences give the 3-cycle 110110110... → 101101101... → 011011011... → 110110110.... Either of these 3-cycles can be converted to fraction form: for example, the first-given 3-cycle can be written as 1/7 → 2/7 → 4/7 → 1/7. Using the above translation from the bit-shift map to the r = 4 logistic map gives the corresponding logistic cycle .611260467... → .950484434... → .188255099... → .611260467... . We could similarly translate the other bit-shift 3-cycle into its corresponding logistic cycle. Likewise, cycles of any length k can be found in the bit-shift map and then translated into the corresponding logistic cycles.
However, since almost all numbers in [0, 1) are irrational, almost all initial conditions of the bit-shift map lead to the non-periodicity of chaos. This is one way to see that the logistic r = 4 map is chaotic for almost all initial conditions.
Polynomial
In mathematics, a polynomial is an expression of finite length constructed from variables and constants, using only the operations of addition, subtraction, multiplication, and non-negative integer exponents...
mapping
Map (mathematics)
In most of mathematics and in some related technical fields, the term mapping, usually shortened to map, is either a synonym for function, or denotes a particular kind of function which is important in that branch, or denotes something conceptually similar to a function.In graph theory, a map is a...
(equivalently, recurrence relation
Recurrence relation
In mathematics, a recurrence relation is an equation that recursively defines a sequence, once one or more initial terms are given: each further term of the sequence is defined as a function of the preceding terms....
) of degree 2
Quadratic function
A quadratic function, in mathematics, is a polynomial function of the formf=ax^2+bx+c,\quad a \ne 0.The graph of a quadratic function is a parabola whose axis of symmetry is parallel to the y-axis....
, often cited as an archetypal example of how complex, chaotic
Chaos theory
Chaos theory is a field of study in mathematics, with applications in several disciplines including physics, economics, biology, and philosophy. Chaos theory studies the behavior of dynamical systems that are highly sensitive to initial conditions, an effect which is popularly referred to as the...
behaviour can arise from very simple non-linear dynamical equations. The map was popularized in a seminal 1976 paper by the biologist Robert May
Robert May, Baron May of Oxford
Robert McCredie May, Baron May of Oxford, OM, AC, PRS is an Australian scientist who has been Chief Scientific Adviser to the UK Government, President of the Royal Society, and a Professor at Sydney and Princeton. He now holds joint professorships at Oxford, and Imperial College London...
, in part as a discrete-time demographic model analogous to the logistic equation first created by Pierre François Verhulst
Pierre François Verhulst
Pierre François Verhulst was a mathematician and a doctor in number theory from the University of Ghent in 1825...
.
Mathematically, the logistic map is written
where:
is a number between zero and one, and represents the ratio of existing population to the maximum possible population at year n, and hence x0 represents the initial ratio of population to max. population (at year 0)
- r is a positive number, and represents a combined rate for reproduction and starvation.
This nonlinear difference equation is intended to capture two effects.
- reproduction where the population will increase at a rate proportionalProportionality (mathematics)In mathematics, two variable quantities are proportional if one of them is always the product of the other and a constant quantity, called the coefficient of proportionality or proportionality constant. In other words, are proportional if the ratio \tfrac yx is constant. We also say that one...
to the current population when the population size is small. - starvation (density-dependent mortality) where the growth rate will decrease at a rate proportional to the value obtained by taking the theoretical "carrying capacity" of the environment less the current population.
However, as a demographic model the logistic map has the pathological problem that some initial conditions and parameter values lead to negative population sizes. This problem does not appear in the older Ricker model
Ricker model
The Ricker model, named after Bill Ricker, is a classic discrete population model which gives the expected number a t+1 of individuals in generation t + 1 as a function of the number of individuals in the previous generation,Here r is interpreted as an intrinsic growth rate and k as...
, which also exhibits chaotic dynamics.
The r=4 case of the logistic map is a nonlinear transformation of both the bit shift map and the
case of the tent map.Behavior dependent on r
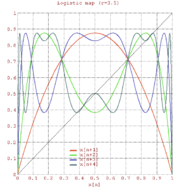
By varying the parameter r, the following behavior is observed:- With r between 0 and 1, the population will eventually die, independent of the initial population.
- With r between 1 and 2, the population will quickly approach the value
 , independent of the initial population.
 - With r between 2 and 3, the population will also eventually approach the same value
 , but first will fluctuate around that value for some time. The rate of convergenceRate of convergenceIn numerical analysis, the speed at which a convergent sequence approaches its limit is called the rate of convergence. Although strictly speaking, a limit does not give information about any finite first part of the sequence, this concept is of practical importance if we deal with a sequence of...
is linear, except for r=3, when it is dramatically slow, less than linear. - With r between 3 and
 (approximately 3.45), from almost allAlmost allIn mathematics, the phrase "almost all" has a number of specialised uses."Almost all" is sometimes used synonymously with "all but finitely many" or "all but a countable set" ; see almost....
initial conditions the population will approach permanent oscillations between two values. These two values are dependent on r. - With r between 3.45 and 3.54 (approximately), from almost all initial conditions the population will approach permanent oscillations among four values.
- With r increasing beyond 3.54, from almost all initial conditions the population will approach oscillations among 8 values, then 16, 32, etc. The lengths of the parameter intervals which yield oscillations of a given length decrease rapidly; the ratio between the lengths of two successive such bifurcation intervals approaches the Feigenbaum constant δ = 4.669
 . This behavior is an example of a period-doubling cascadePeriod-doubling bifurcationIn mathematics, a period doubling bifurcation in a discrete dynamical system is a bifurcation in which the system switches to a new behavior with twice the period of the original system...
. - At r approximately 3.57 is the onset of chaos, at the end of the period-doubling cascade. From almost all initial conditions we can no longer see any oscillations of finite period. Slight variations in the initial population yield dramatically different results over time, a prime characteristic of chaos.
- Most values beyond 3.57 exhibit chaotic behaviour, but there are still certain isolated ranges of r that show non-chaotic behavior; these are sometimes called islands of stability. For instance, beginning at
 (approximately 3.83) there is a range of parameters r which show oscillation among three values, and for slightly higher values of r oscillation among 6 values, then 12 etc.
 - The development of the chaotic behavior of the logistic sequence as the parameter r varies from approximately 3.5699 to approximately 3.8284 is sometimes called the Pomeau–Manneville scenarioPomeau–Manneville scenarioIn the theory of dynamical systems , the Pomeau–Manneville scenario is the transition to chaos due to intermittency....
, which is characterized by a periodic (laminar) phase interrupted by bursts of aperiodic behavior. Such a scenario has an application in semiconductor devices. There are other ranges which yield oscillation among 5 values etc.; all oscillation periods occur for some values of r. A period-doubling window with parameter c is a range of r-values consisting of a succession of sub-ranges. The kth sub-range contains the values of r for which there is a stable cycle (a cycle which attracts a set of initial points of unit measure) of period This sequence of sub-ranges is called a cascade of harmonics. In a sub-range with a stable cycle of period
  there are unstable cycles of period
  for all
  The r value at the end of the infinite sequence of sub-ranges is called the point of accumulation of the cascade of harmonics. As r rises there is a succession of new windows with different c values. The first one is for c = 1; all subsequent windows involving odd c occur in decreasing order of c starting with arbitrarily large c.
 - Beyond r = 4, the values eventually leave the interval [0,1] and diverge for almost all initial values.
For any value of r there is at most one stable cycle. A stable cycle attracts almost all points. For an r with a stable cycle of some period, there can be infinitely many unstable cycles of various periods.
A bifurcation diagram
Bifurcation diagram
In mathematics, particularly in dynamical systems, a bifurcation diagram shows the possible long-term values of a system as a function of a bifurcation parameter in the system...
summarizes this. The horizontal axis shows the values of the parameter r while the vertical axis shows the possible long-term values of x.
The bifurcation diagram is a fractal
Fractal
A fractal has been defined as "a rough or fragmented geometric shape that can be split into parts, each of which is a reduced-size copy of the whole," a property called self-similarity...
: if you zoom in on the above mentioned value r = 3.82 and focus on one arm of the three, the situation nearby looks like a shrunk and slightly distorted version of the whole diagram. The same is true for all other non-chaotic points. This is an example of the deep and ubiquitous connection between chaos and fractals.
Chaos and the logistic map
Quadratic polynomial
In mathematics, a quadratic polynomial or quadratic is a polynomial of degree two, also called second-order polynomial. That means the exponents of the polynomial's variables are no larger than 2...
difference equation (1) describing it may be thought of as a stretching-and-folding operation on the interval (0,1).
The following figure illustrates the stretching and folding over a sequence of iterates of the map. Figure (a), left, gives a two-dimensional phase
Phase space
In mathematics and physics, a phase space, introduced by Willard Gibbs in 1901, is a space in which all possible states of a system are represented, with each possible state of the system corresponding to one unique point in the phase space...
diagram of the logistic map for r=4, and clearly shows the quadratic curve of the difference equation (1). However, we can embed
Embedding
In mathematics, an embedding is one instance of some mathematical structure contained within another instance, such as a group that is a subgroup....
the same sequence in a three-dimensional phase space, in order to investigate the deeper structure of the map. Figure (b), right, demonstrates this, showing how initially nearby points begin to diverge, particularly in those regions of Xt corresponding to the steeper sections of the plot.
This stretching-and-folding does not just produce a gradual divergence of the sequences of iterates, but an exponential divergence (see Lyapunov exponent
Lyapunov exponent
In mathematics the Lyapunov exponent or Lyapunov characteristic exponent of a dynamical system is a quantity that characterizes the rate of separation of infinitesimally close trajectories...
s), evidenced also by the complexity
Complexity
In general usage, complexity tends to be used to characterize something with many parts in intricate arrangement. The study of these complex linkages is the main goal of complex systems theory. In science there are at this time a number of approaches to characterizing complexity, many of which are...
and unpredictability of the chaotic logistic map. In fact, exponential divergence of sequences of iterates explains the connection between chaos and unpredictability: a small error in the supposed initial state of the system will tend to correspond to a large error later in its evolution. Hence, predictions about future states become progressively (indeed, exponentially
Exponential growth
Exponential growth occurs when the growth rate of a mathematical function is proportional to the function's current value...
) worse when there are even very small errors in our knowledge of the initial state.
Since the map is confined to an interval on the real number line, its dimension is less than or equal to unity. Numerical estimates yield a correlation dimension
Correlation dimension
In chaos theory, the correlation dimension is a measure of the dimensionality of the space occupied by a set of random points, often referred to as a type of fractal dimension....
of 0.500 ± 0.005 (Grassberger
Peter Grassberger
-External links:*...
, 1983), a Hausdorff dimension
Hausdorff dimension
thumb|450px|Estimating the Hausdorff dimension of the coast of Great BritainIn mathematics, the Hausdorff dimension is an extended non-negative real number associated with any metric space. The Hausdorff dimension generalizes the notion of the dimension of a real vector space...
of about 0.538 (Grassberger
Peter Grassberger
-External links:*...
1981), and an information dimension of 0.5170976... (Grassberger
Peter Grassberger
-External links:*...
1983) for r=3.5699456... (onset of chaos). Note: It can be shown that the correlation dimension is certainly between 0.4926 and 0.5024.
It is often possible, however, to make precise and accurate statements about the likelihood of a future state in a chaotic system. If a (possibly chaotic) dynamical system
Dynamical system
A dynamical system is a concept in mathematics where a fixed rule describes the time dependence of a point in a geometrical space. Examples include the mathematical models that describe the swinging of a clock pendulum, the flow of water in a pipe, and the number of fish each springtime in a...
has an attractor
Attractor
An attractor is a set towards which a dynamical system evolves over time. That is, points that get close enough to the attractor remain close even if slightly disturbed...
, then there exists a probability measure
Probability measure
In mathematics, a probability measure is a real-valued function defined on a set of events in a probability space that satisfies measure properties such as countable additivity...
that gives the long-run proportion of time spent by the system in the various regions of the attractor. In the case of the logistic map with parameter r = 4 and an initial state in (0,1), the attractor is also the interval (0,1) and the probability measure corresponds to the beta distribution with parameters a = 0.5 and b = 0.5. Specifically, the invariant measure is
. Unpredictability is not randomness, but in some circumstances looks very much like it. Hence, and fortunately, even if we know very little about the initial state of the logistic map (or some other chaotic system), we can still say something about the distribution of states a long time into the future, and use this knowledge to inform decisionDecision theory
Decision theory in economics, psychology, philosophy, mathematics, and statistics is concerned with identifying the values, uncertainties and other issues relevant in a given decision, its rationality, and the resulting optimal decision...
s based on the state of the system.
Solution in some cases
The special case of r = 4 can in fact be solved exactly, as can the case with r = 2; however the general case can only be predicted statistically.The solution when r = 4 is,
where the initial condition parameter
is given by . For rational , after a finite number of iterations maps into a periodic sequence. But almost all are irrational, and for irrational never repeats itself – it is non-periodic. This solution equation clearly demonstrates the two key features of chaos – stretching and folding: the factor 2n shows the exponential growth of stretching, which results in sensitive dependence on initial conditions, while the squared sine function keeps folded within the range [0, 1].By contrast, the solution when r=2 is
for
. Since for any value of other than the unstable fixed point 0, the term goes to 0 as n goes to infinity, so goes to the stable fixed point Finding cycles of any length when r = 4
For the r = 4 case, from almost all initial conditions the iterate sequence is chaotic. Nevertheless, there exist an infinite number of initial conditions which lead to cycles, and indeed there exist cycles of length k for all integers k ≥ 1. We can exploit the relationship of the logistic map to the dyadic transformationDyadic transformation
The dyadic transformation is the mapping produced by the rule...
(also known as the bit-shift map) to find cycles of any length. If x follows the logistic map
and y follows the dyadic transformation
then the two are related by
.The reason that the dyadic transformation is also called the bit-shift map is that when y is written in binary notation, the map moves the binary point one place to the right (and if the bit to the left of the binary point has become a "1", this "1" is changed to a "0"). A cycle of length 3, for example, occurs if an iterate has a 3-bit repeating sequence in its binary expansion (which is not also a one-bit repeating sequence): 001, 010, 100, 110, 101, or 011. The iterate 001001001... maps into 010010010..., which maps into 100100100..., which in turn maps into the original 001001001...; so this is a 3-cycle of the bit shift map. And the other three binary-expansion repeating sequences give the 3-cycle 110110110... → 101101101... → 011011011... → 110110110.... Either of these 3-cycles can be converted to fraction form: for example, the first-given 3-cycle can be written as 1/7 → 2/7 → 4/7 → 1/7. Using the above translation from the bit-shift map to the r = 4 logistic map gives the corresponding logistic cycle .611260467... → .950484434... → .188255099... → .611260467... . We could similarly translate the other bit-shift 3-cycle into its corresponding logistic cycle. Likewise, cycles of any length k can be found in the bit-shift map and then translated into the corresponding logistic cycles.
However, since almost all numbers in [0, 1) are irrational, almost all initial conditions of the bit-shift map lead to the non-periodicity of chaos. This is one way to see that the logistic r = 4 map is chaotic for almost all initial conditions.
See also
- Malthusian growth modelMalthusian growth modelThe Malthusian growth model, sometimes called the simple exponential growth model, is essentially exponential growth based on a constant rate of compound interest...
- Chaos theoryChaos theoryChaos theory is a field of study in mathematics, with applications in several disciplines including physics, economics, biology, and philosophy. Chaos theory studies the behavior of dynamical systems that are highly sensitive to initial conditions, an effect which is popularly referred to as the...
- List of chaotic maps
- Logistic functionLogistic functionA logistic function or logistic curve is a common sigmoid curve, given its name in 1844 or 1845 by Pierre François Verhulst who studied it in relation to population growth. It can model the "S-shaped" curve of growth of some population P...
the continuous version - Stiff equationStiff equationIn mathematics, a stiff equation is a differential equation for which certain numerical methods for solving the equation are numerically unstable, unless the step size is taken to be extremely small. It has proved difficult to formulate a precise definition of stiffness, but the main idea is that...
- Lyapunov stabilityLyapunov stabilityVarious types of stability may be discussed for the solutions of differential equations describing dynamical systems. The most important type is that concerning the stability of solutions near to a point of equilibrium. This may be discussed by the theory of Lyapunov...
for iterated systems - Radial basis function networkRadial basis function networkA radial basis function network is an artificial neural network that uses radial basis functions as activation functions. It is a linear combination of radial basis functions...
This article illustrates the inverse problem for the logistic map. - Complex quadratic map
- Schröder's equation
External links
- Logistic Map Simulation. A Java applet simulating the Logistic Map by Yuval Baror.
- Logistic Map. Contains an interactive computer simulation of the logistic map.
- The Chaos Hypertextbook. An introductory primer on chaos and fractals.
- Interactive Logistic map with iteration and bifurcation diagrams in Java.
- Interactive Logistic map showing fixed points.
- Macintosh Quadratic Map Program
- The transition to Chaos and the Feigenbaum constant- JAVA applet
- The Logistic Map and Chaos by Elmer G. Wiens
- Complexity & Chaos (audiobook) by Roger White. Chapter 5 covers the Logistic Equation.
- "History of iterated maps," in A New Kind of ScienceA New Kind of ScienceA New Kind of Science is a book by Stephen Wolfram, published in 2002. It contains an empirical and systematic study of computational systems such as cellular automata...
by Stephen WolframStephen WolframStephen Wolfram is a British scientist and the chief designer of the Mathematica software application and the Wolfram Alpha computational knowledge engine.- Biography :...
. Champaign, IL: Wolfram Media, p. 918, 2002. - Discrete Logistic Equation by Marek Bodnar after work by Phil Ramsden, Wolfram Demonstrations ProjectWolfram Demonstrations ProjectThe Wolfram Demonstrations Project is hosted by Wolfram Research, whose stated goal is to bring computational exploration to the widest possible audience. It consists of an organized, open-source collection of small interactive programs called Demonstrations, which are meant to visually and...
. - Multiplicative coupling of 2 logistic maps by C. Pellicer-Lostao and R. Lopez-Ruiz after work by Ed Pegg Jr, Wolfram Demonstrations ProjectWolfram Demonstrations ProjectThe Wolfram Demonstrations Project is hosted by Wolfram Research, whose stated goal is to bring computational exploration to the widest possible audience. It consists of an organized, open-source collection of small interactive programs called Demonstrations, which are meant to visually and...
. - Using SAGE to investigate the discrete logistic equation