
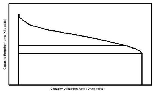
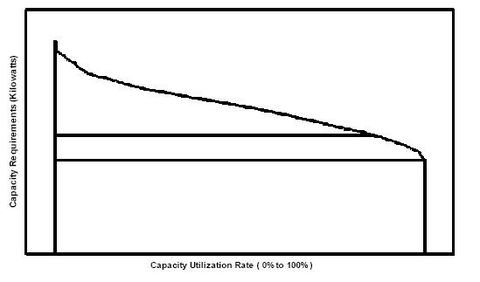
Load Duration Curve
Encyclopedia
Electricity generation
Electricity generation is the process of generating electric energy from other forms of energy.The fundamental principles of electricity generation were discovered during the 1820s and early 1830s by the British scientist Michael Faraday...
to illustrate the relationship between generating capacity requirements and capacity utilization.
A LDC is similar to a load curve
Load curve
]A load curve is a chart showing the amount of electrical energy customers use over the course of time. Power producers use this information to plan how much electricity they will need to make available at any given time...
but the demand data is ordered in descending
order of magnitude, rather than chronologically. The LDC curve shows the capacity utilization
requirements for each increment of load. The height of each slice is a measure of capacity, and
the width of each slice is a measure of the utilization rate or capacity factor. The product of the
two is a measure of electrical energy (e.g. kilowatthours).
A price duration curve shows the proportion of time for which the price exceeded a certain value.
Together, the price duration curve and load duration curve enable the analyst to understand the behaviour of the electricity market, for example, the likelihood of peaking plant to be required for service, and the impact that this might have on price.