
Least absolute deviations
Encyclopedia
Least absolute deviations (LAD), also known as Least Absolute Errors (LAE), Least Absolute Value (LAV), or the L1 norm problem, is a mathematical
optimization
technique similar to the popular least squares
technique that attempts to find a function
which closely approximates a set of data. In the simple case of a set of (x,y) data, the approximation function is a simple "trend line" in two-dimensional Cartesian coordinates. The method minimizes
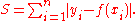
the sum of absolute errors (SAE) (the sum of the absolute values of the vertical "residuals" between points generated by the function and corresponding points in the data). The least absolute deviations estimate also arises as the maximum likelihood
estimate if the errors have a Laplace distribution.
consists of the points (xi, yi) with i = 1, 2, ..., n. We want to find a function f such that
To attain this goal, we suppose that the function f is of a particular form containing some parameters which need to be determined. For instance, the simplest form would be linear: f(x) = bx + c, where b and c parameters whose values are not known but which we would like to estimate. Less simply, suppose that f(x) is quadratic
, meaning that f(x) = ax2 + bx + c, where a, b and c are not yet known. (More generally, there could be not just one explanator x, but rather multiple explanators, all appearing as arguments of the function f.)
We now seek estimated values of the unknown parameters that minimize the sum of the absolute values of the residuals:
The method of least absolute deviations finds applications in many areas, due to its robustness compared to the least squares method. Least absolute deviations is robust in that it is resistant to outliers in the data. This may be helpful in studies where outliers may be safely and effectively ignored. If it is important to pay attention to any and all outliers, the method of least squares is a better choice.
The instability property of the method of least absolute deviations means that, for a small horizontal adjustment of a datum
, the regression line may jump a large amount. The method has continuous solutions for some data configurations; however, by moving a datum a small amount, one could "jump past" a configuration which has multiple solutions that span a region. After passing this region of solutions, the least absolute deviations line has a slope that may differ greatly from that of the previous line. In contrast, the least squares solutions is stable in that, for any small adjustment of a data point, the regression line will always move only slightly; that is, the regression parameters are continuous functions of the data.
Lastly, for a given data set, the method of least absolute deviations may produce multiple solutions, whereas the method of least squares always produces only one solution (the regression line is unique).
For a set of applets that demonstrate these differences, see the following site: http://www.math.wpi.edu/Course_Materials/SAS/lablets/7.3/73_choices.html
This "latching" of the line to the data points can help to understand the "instability" property: if the line always latches to at least two points, then the line will jump between different sets of points as the data points are altered. The "latching" also helps to understand the "robustness" property: if there exists an outlier, and a least absolute deviations line must latch onto two data points, the outlier will most likely not be one of those two points because that will not minimize the sum of absolute deviations in most cases.
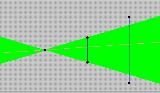
One known case in which multiple solutions exist is a set of points symmetric about a horizontal line, as shown in Figure A below.
To understand why there are multiple solutions in the case shown in Figure A, consider the pink line in the green region. Its sum of absolute errors is some value S. If one were to tilt the line upward slightly, while still keeping it within the green region, the sum of errors would still be S. It would not change because the distance from each point to the line grows on one side of the line, while the distance to each point on the opposite side of the line diminishes by exactly the same amount. Thus the sum of absolute errors remains the same. Also, since one can tilt the line in infinitely small increments, this also shows that if there is more than one solution, there are infinitely many solutions.
, e.g., a linear model with linear constraints:
Regularization
with LASSO may also be combined with LAD.
Simplex-based methods are the “preferred” way to solve the least absolute deviations problem. A Simplex method is a method for solving a problem in linear programming. The most popular algorithm is the Barrodale-Roberts modified Simplex algorithm. The algorithms for IRLS, Wesolowsky's Method, and Li's Method can be found in Appendix A of this document,
among other methods. Checking all combinations of lines traversing any two (x,y) data points is another method of finding the least absolute deviations line. Since it is known that at least one least absolute deviations line traverses at least two data points, this method will find a line by comparing the SAE of each line, and choosing the line with the smallest SAE. In addition, if multiple lines have the same, smallest SAE, then the lines outline the region of multiple solutions. Though simple, this final method is inefficient for large sets of data.

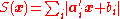
with respect to the choice of the values of the parameters , where yi is the value of the ith observation of the dependent variable, and xij is the value of the ith observation of the jth independent variable (j = 1,...,k). We rewrite this problem in terms of artificial variables ui as


These constraints have the effect of forcing each to equal
  upon being minimized, so the objective function is equivalent to the original objective function. Since this version of the problem statement does not contain the absolute value operator, it is in a format that can be solved with any linear programming package.
Mathematics
Mathematics is the study of quantity, space, structure, and change. Mathematicians seek out patterns and formulate new conjectures. Mathematicians resolve the truth or falsity of conjectures by mathematical proofs, which are arguments sufficient to convince other mathematicians of their validity...
optimization
Optimization (mathematics)
In mathematics, computational science, or management science, mathematical optimization refers to the selection of a best element from some set of available alternatives....
technique similar to the popular least squares
Least squares
The method of least squares is a standard approach to the approximate solution of overdetermined systems, i.e., sets of equations in which there are more equations than unknowns. "Least squares" means that the overall solution minimizes the sum of the squares of the errors made in solving every...
technique that attempts to find a function
Function (mathematics)
In mathematics, a function associates one quantity, the argument of the function, also known as the input, with another quantity, the value of the function, also known as the output. A function assigns exactly one output to each input. The argument and the value may be real numbers, but they can...
which closely approximates a set of data. In the simple case of a set of (x,y) data, the approximation function is a simple "trend line" in two-dimensional Cartesian coordinates. The method minimizes
Maxima and minima
In mathematics, the maximum and minimum of a function, known collectively as extrema , are the largest and smallest value that the function takes at a point either within a given neighborhood or on the function domain in its entirety .More generally, the...
the sum of absolute errors (SAE) (the sum of the absolute values of the vertical "residuals" between points generated by the function and corresponding points in the data). The least absolute deviations estimate also arises as the maximum likelihood
Maximum likelihood
In statistics, maximum-likelihood estimation is a method of estimating the parameters of a statistical model. When applied to a data set and given a statistical model, maximum-likelihood estimation provides estimates for the model's parameters....
estimate if the errors have a Laplace distribution.
Formulation of the problem
Suppose that the data setData set
A data set is a collection of data, usually presented in tabular form. Each column represents a particular variable. Each row corresponds to a given member of the data set in question. Its values for each of the variables, such as height and weight of an object or values of random numbers. Each...
consists of the points (xi, yi) with i = 1, 2, ..., n. We want to find a function f such that
To attain this goal, we suppose that the function f is of a particular form containing some parameters which need to be determined. For instance, the simplest form would be linear: f(x) = bx + c, where b and c parameters whose values are not known but which we would like to estimate. Less simply, suppose that f(x) is quadratic
Quadratic function
A quadratic function, in mathematics, is a polynomial function of the formf=ax^2+bx+c,\quad a \ne 0.The graph of a quadratic function is a parabola whose axis of symmetry is parallel to the y-axis....
, meaning that f(x) = ax2 + bx + c, where a, b and c are not yet known. (More generally, there could be not just one explanator x, but rather multiple explanators, all appearing as arguments of the function f.)
We now seek estimated values of the unknown parameters that minimize the sum of the absolute values of the residuals:
Contrasting Least Squares with Least Absolute Deviations
The following is a table contrasting some properties of the method of least absolute deviations with those of the method of least squares (for non-singular problems).| Least Squares Regression | Least Absolute Deviations Regression | |
|---|---|---|
| Not very robust | Robust | |
| Stable solution | Unstable solution | |
| Always one solution | Possibly multiple solutions | |
The method of least absolute deviations finds applications in many areas, due to its robustness compared to the least squares method. Least absolute deviations is robust in that it is resistant to outliers in the data. This may be helpful in studies where outliers may be safely and effectively ignored. If it is important to pay attention to any and all outliers, the method of least squares is a better choice.
The instability property of the method of least absolute deviations means that, for a small horizontal adjustment of a datum
Datum
A geodetic datum is a reference from which measurements are made. In surveying and geodesy, a datum is a set of reference points on the Earth's surface against which position measurements are made, and an associated model of the shape of the earth to define a geographic coordinate system...
, the regression line may jump a large amount. The method has continuous solutions for some data configurations; however, by moving a datum a small amount, one could "jump past" a configuration which has multiple solutions that span a region. After passing this region of solutions, the least absolute deviations line has a slope that may differ greatly from that of the previous line. In contrast, the least squares solutions is stable in that, for any small adjustment of a data point, the regression line will always move only slightly; that is, the regression parameters are continuous functions of the data.
Lastly, for a given data set, the method of least absolute deviations may produce multiple solutions, whereas the method of least squares always produces only one solution (the regression line is unique).
For a set of applets that demonstrate these differences, see the following site: http://www.math.wpi.edu/Course_Materials/SAS/lablets/7.3/73_choices.html
Other properties
There exist other unique properties of the least absolute deviations line. In the case of a set of (x,y) data, the least absolute deviations line will always pass through at least two of the data points, unless there are multiple solutions. If multiple solutions exist, then the region of valid least absolute deviations solutions will be bounded by at least two lines, each of which passes through at least two data points. More generally, if there are k regressors (including the constant), then at least one optimal regression surface will pass through k of the data points.This "latching" of the line to the data points can help to understand the "instability" property: if the line always latches to at least two points, then the line will jump between different sets of points as the data points are altered. The "latching" also helps to understand the "robustness" property: if there exists an outlier, and a least absolute deviations line must latch onto two data points, the outlier will most likely not be one of those two points because that will not minimize the sum of absolute deviations in most cases.
One known case in which multiple solutions exist is a set of points symmetric about a horizontal line, as shown in Figure A below.
To understand why there are multiple solutions in the case shown in Figure A, consider the pink line in the green region. Its sum of absolute errors is some value S. If one were to tilt the line upward slightly, while still keeping it within the green region, the sum of errors would still be S. It would not change because the distance from each point to the line grows on one side of the line, while the distance to each point on the opposite side of the line diminishes by exactly the same amount. Thus the sum of absolute errors remains the same. Also, since one can tilt the line in infinitely small increments, this also shows that if there is more than one solution, there are infinitely many solutions.
Variations, extensions, specializations
The least absolute deviation problem may be extended to include constraints and regularizationRegularization (mathematics)
In mathematics and statistics, particularly in the fields of machine learning and inverse problems, regularization involves introducing additional information in order to solve an ill-posed problem or to prevent overfitting...
, e.g., a linear model with linear constraints:
- minimize
- subject to, e.g.,

Regularization
Regularization (mathematics)
In mathematics and statistics, particularly in the fields of machine learning and inverse problems, regularization involves introducing additional information in order to solve an ill-posed problem or to prevent overfitting...
with LASSO may also be combined with LAD.
Solving Methods
Though the idea of least absolute deviations regression is just as straightforward as that of least squares regression, the least absolute deviations line is not as simple to compute efficiently. Unlike least squares regression, least absolute deviations regression does not have an analytical solving method. Therefore, an iterative approach is required. The following is an enumeration of some least absolute deviations solving methods.- Simplex-based methodsSimplex algorithmIn mathematical optimization, Dantzig's simplex algorithm is a popular algorithm for linear programming. The journal Computing in Science and Engineering listed it as one of the top 10 algorithms of the twentieth century....
(such as the Barrodale-Roberts algorithm) - Iteratively re-weighted least squaresIteratively re-weighted least squaresThe method of iteratively reweighted least squares is used to solve certain optimization problems. It solves objective functions of the form:...
- Wesolowsky’s direct descent method
- Li-Arce’s maximum likelihood approach
- Check all combinations of point-to-point lines for minimum sum of errors
Simplex-based methods are the “preferred” way to solve the least absolute deviations problem. A Simplex method is a method for solving a problem in linear programming. The most popular algorithm is the Barrodale-Roberts modified Simplex algorithm. The algorithms for IRLS, Wesolowsky's Method, and Li's Method can be found in Appendix A of this document,
among other methods. Checking all combinations of lines traversing any two (x,y) data points is another method of finding the least absolute deviations line. Since it is known that at least one least absolute deviations line traverses at least two data points, this method will find a line by comparing the SAE of each line, and choosing the line with the smallest SAE. In addition, if multiple lines have the same, smallest SAE, then the lines outline the region of multiple solutions. Though simple, this final method is inefficient for large sets of data.
Solving using linear programming
The problem can be solved using any linear programming technique on the following problem specification. We wish towith respect to the choice of the values of the parameters
, where yi is the value of the ith observation of the dependent variable, and xij is the value of the ith observation of the jth independent variable (j = 1,...,k). We rewrite this problem in terms of artificial variables ui as- with respect to
 and
and 
- subject to
These constraints have the effect of forcing each
to equal upon being minimized, so the objective function is equivalent to the original objective function. Since this version of the problem statement does not contain the absolute value operator, it is in a format that can be solved with any linear programming package.See also
- Regression analysisRegression analysisIn statistics, regression analysis includes many techniques for modeling and analyzing several variables, when the focus is on the relationship between a dependent variable and one or more independent variables...
- Linear regression model
- Absolute deviationAbsolute deviationIn statistics, the absolute deviation of an element of a data set is the absolute difference between that element and a given point. Typically the point from which the deviation is measured is a measure of central tendency, most often the median or sometimes the mean of the data set.D_i = |x_i-m|...
- Ordinary least squaresOrdinary least squaresIn statistics, ordinary least squares or linear least squares is a method for estimating the unknown parameters in a linear regression model. This method minimizes the sum of squared vertical distances between the observed responses in the dataset and the responses predicted by the linear...