
Kuznets curve
Encyclopedia
Simon Kuznets
Simon Smith Kuznets was a Russian American economist at the Wharton School of the University of Pennsylvania who won the 1971 Nobel Memorial Prize in Economic Sciences "for his empirically founded interpretation of economic growth which has led to new and deepened insight into the economic and...
' hypothesis that economic inequality
Economic inequality
Economic inequality comprises all disparities in the distribution of economic assets and income. The term typically refers to inequality among individuals and groups within a society, but can also refer to inequality among countries. The issue of economic inequality is related to the ideas of...
increases over time while a country is developing, and then after a certain average income is attained, inequality begins to decrease.
One theory as to why this happens states that in early stages of development
Economic development
Economic development generally refers to the sustained, concerted actions of policymakers and communities that promote the standard of living and economic health of a specific area...
, when investment in physical capital
Physical capital
In economics, physical capital or just 'capital' refers to any already-manufactured asset that is applied in production, such as machinery, buildings, or vehicles. In economic theory, physical capital is one of the three primary factors of production, also known as inputs in the production function...
is the main mechanism of economic growth, inequality encourages growth by allocating resources towards those who save and invest the most. Whereas in mature economies human capital
Human capital
Human capitalis the stock of competencies, knowledge and personality attributes embodied in the ability to perform labor so as to produce economic value. It is the attributes gained by a worker through education and experience...
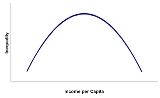
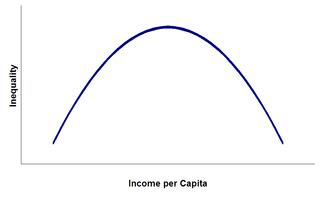
accrual, or an estimate of cost that has been incurred but not yet paid, takes the place of physical capital accrual as the main source of growth, and inequality slows growth by lowering education standards because poor people lack finance for their education in imperfect credit markets. Kuznets curve diagrams show an inverted U curve, although variables along the axes are often mixed and matched, with inequality or the Gini coefficient
Gini coefficient
The Gini coefficient is a measure of statistical dispersion developed by the Italian statistician and sociologist Corrado Gini and published in his 1912 paper "Variability and Mutability" ....
on the Y axis and economic development, time or per capita income
Per capita income
Per capita income or income per person is a measure of mean income within an economic aggregate, such as a country or city. It is calculated by taking a measure of all sources of income in the aggregate and dividing it by the total population...
s on the X axis.
Since 1991, Environmental Kuznets Curves (EKC) have become standard features in the technical literature of environmental policy
Environmental policy
Environmental policy is any [course of] action deliberately taken [or not taken] to manage human activities with a view to prevent, reduce, or mitigate harmful effects on nature and natural resources, and ensuring that man-made changes to the environment do not have harmful effects on...
, though their application here is strongly contested.
Kuznets ratio
The Kuznets ratio is a measurement of the ratio of income going to the highest-earning households (usually defined by the upper 20%) and the income going to the lowest-earning households, which is commonly measured by either the lowest 20% or lowest 40% of income. Comparing 20% to 20%, perfect equality is expressed as 1; 20% to 40% changes this value to 0.5.Kuznets had two similar explanations for this historical phenomenon:
- workers migrated from agriculture to industry; and
- rural workers moved to urban jobs.
In both explanations, inequality will decrease after 50% of the shift force switches over to the higher paying sector.
Criticisms
Critics of the Kuznets Curve theory argue that its U-shape comes not from progression in the development of individual countries, but rather from historical differences between countries. For instance, many of the middle income countries used in Kuznets' data set were in Latin AmericaLatin America
Latin America is a region of the Americas where Romance languages – particularly Spanish and Portuguese, and variably French – are primarily spoken. Latin America has an area of approximately 21,069,500 km² , almost 3.9% of the Earth's surface or 14.1% of its land surface area...
, a region with historically high levels of inequality. When controlling for this variable, the U-shape of the curve tends to disappear (e.g. Deininger and Squire, 1998).
Regarding the empirical evidence, based on large panels of countries or time series approaches, Fields (2001) considers the Kuznets hypothesis refuted.
In accounting for historical changes, David Lempert's work in the early 1980s introduced a time dimension and a political dimension to the curve, showing how population and politics interact with economic inequality over time, leading either to long-term stability or to collapse. This neo-Malthusian model incorporating Kuznets' work, yields a helix
Helix
A helix is a type of smooth space curve, i.e. a curve in three-dimensional space. It has the property that the tangent line at any point makes a constant angle with a fixed line called the axis. Examples of helixes are coil springs and the handrails of spiral staircases. A "filled-in" helix – for...
model of the relationships over time rather than just a curve.
Environmental Kuznets Curves
The environmental Kuznets curve is a hypothesized relationship between variousindicators of environmental degradation and income per capital. The situation where Kuznets curves have purportedly been observed is the environment
Environment (biophysical)
The biophysical environment is the combined modeling of the physical environment and the biological life forms within the environment, and includes all variables, parameters as well as conditions and modes inside the Earth's biosphere. The biophysical environment can be divided into two categories:...
. Although the subject of continuing debate, some evidence supports the claim that environmental health indicators, such as water
Water pollution
Water pollution is the contamination of water bodies . Water pollution occurs when pollutants are discharged directly or indirectly into water bodies without adequate treatment to remove harmful compounds....
and air pollution
Air pollution
Air pollution is the introduction of chemicals, particulate matter, or biological materials that cause harm or discomfort to humans or other living organisms, or cause damage to the natural environment or built environment, into the atmosphere....
, show the inverted U-shaped curve. It has been argued that this trend occurs in the level of many of the environmental pollutants, such as sulfur dioxide
Sulfur dioxide
Sulfur dioxide is the chemical compound with the formula . It is released by volcanoes and in various industrial processes. Since coal and petroleum often contain sulfur compounds, their combustion generates sulfur dioxide unless the sulfur compounds are removed before burning the fuel...
, nitrogen oxide
Nitrogen oxide
Nitrogen oxide can refer to a binary compound of oxygen and nitrogen, or a mixture of such compounds:* Nitric oxide, also known as nitrogen monoxide, , nitrogen oxide* Nitrogen dioxide , nitrogen oxide...
, lead
Lead
Lead is a main-group element in the carbon group with the symbol Pb and atomic number 82. Lead is a soft, malleable poor metal. It is also counted as one of the heavy metals. Metallic lead has a bluish-white color after being freshly cut, but it soon tarnishes to a dull grayish color when exposed...
, DDT
DDT
DDT is one of the most well-known synthetic insecticides. It is a chemical with a long, unique, and controversial history....
, chlorofluorocarbons, sewage
Sewage
Sewage is water-carried waste, in solution or suspension, that is intended to be removed from a community. Also known as wastewater, it is more than 99% water and is characterized by volume or rate of flow, physical condition, chemical constituents and the bacteriological organisms that it contains...
, and other chemicals previously released directly into the air or water.
For example, between 1970 and 2006, the United States' inflation-adjusted GDP grew by 195%, the number of cars and trucks in the country more than doubled, and the total number of miles driven increased by 178%. However, during that same time period regulatory changes meant that annual emissions of carbon monoxide fell from 197 million tons to 89 million, nitrogen oxides emissions fell from 27 million tons to 19 million, sulfur dioxide emissions fell from 31 million tons to 15 million, particulate emissions fell by 80%, and lead emissions fell by more than 98%.
However, there is little evidence that the relationship holds true for other pollutants, for natural resource use or for biodiversity conservation. For example, energy, land and resource use (sometimes called the "ecological footprint
Ecological footprint
The ecological footprint is a measure of human demand on the Earth's ecosystems. It is a standardized measure of demand for natural capital that may be contrasted with the planet's ecological capacity to regenerate. It represents the amount of biologically productive land and sea area necessary to...
") do not fall with rising income. While the ratio of energy per real GDP
Real GDP
Real Gross Domestic Product is a macroeconomic measure of the value of output economy adjusted for price changes . The adjustment transforms the money-value measure, called nominal GDP, into an index for quantity of total output...
has fallen, total energy use is still rising in most developed countries. Another example is the emission of many greenhouse gases, which is much higher in industrialised countries. In addition, the status of many key "ecosystem services
Ecosystem services
Humankind benefits from a multitude of resources and processes that are supplied by natural ecosystems. Collectively, these benefits are known as ecosystem services and include products like clean drinking water and processes such as the decomposition of wastes...
" provided by ecosystems, such as freshwater provision and regulation (Perman, et al., 2003), soil fertility, and fisheries, have continued to decline in developed countries.
In general, Kuznets curves have been found for some environmental health concerns (such as air pollution) but not for others (such as landfills and biodiversity). Advocates of the EKC argue that this does not necessarily invalidate the hypothesis - the scale of the Kuznets curves may differ for different environmental impacts and different regions. If the search for scalar and regional effects can salvage the concept, it may yet be the case that a given area will need more wealth in order to see a decline in environmental pollutants. In contrast, a thermodynamically enlightened economics suggests that outputs of degraded matter and energy are an inescapable consequence of any use of matter and energy (so holds the second law); some of those degraded outputs will be noxious wastes, and whether and how their production is eliminated depends more on regulatory schemes and technologies at use than on income or production levels. In one view, then, the EKC suggests that "the solution to pollution is more economic growth;" in the other, pollution is seen as a regrettable output that should be reduced when the benefits brought by its production are exceeded by the costs it imposes in externalities like health decrements and loss of ecosystem services.
For statisticians, deforestation
Deforestation
Deforestation is the removal of a forest or stand of trees where the land is thereafter converted to a nonforest use. Examples of deforestation include conversion of forestland to farms, ranches, or urban use....
appears to follow a Kuznets curve. Among countries with a per capita GDP of at least $4,600, net deforestation has ceased to exist. Yet it has been shown that wealthier countries are able to maintain forests along with high consumption by exporting deforestation. For instance, Japan, which is 70% forested, focuses its economy on capital-intensive technological and manufactured goods for export, while purchasing timber that is logged unsustainably and often illegally in the forests of South-East Asia.
Criticisms of environmental Kuznets curves (EKC)
Critics argue that even the US is still struggling to attain the income level necessary to prioritize certain environmental pollutants such as carbon emissions, which have yet to follow the EKC. With other pollutants however, like sulfur dioxide, production seems to coincide with a country's economic development and at a certain threshold level of income a mitigation of environmental damage occurs. This could be related rather than causal, because economic growth without institutional reform does not accomplish this environmental improvement. It appears that with GDP growth, government policies are strengthened and populations experience a rise in their demand for improved environmental quality. It may be the case, however, that regulation in relatively wealthy countries simply shifts the production and pollution to less-regulated, poorer countries; if this were true, the total size of the negative externalities of production remains the same or is larger, though in the wealthier country an EKC appears to have been obtained.This could be a reason why environmental Kuznets curves (EKC) have been found to be applicable to only certain types of pollutants. Yandle et al. argue that the EKC has not been found to apply to carbon because most pollutants create localized problems like lead and sulfur, so there is a greater urgency and response to cleaning up such pollutants. As a country develops, the marginal value of cleaning up such pollutants makes a large direct improvement to the quality of citizens' lives. Conversely, reducing carbon dioxide emissions does not have a dramatic impact at a local level, so the impetus to clean them up is only for the altruistic reason of improving the global environment. This becomes a tragedy of the commons
Tragedy of the commons
The tragedy of the commons is a dilemma arising from the situation in which multiple individuals, acting independently and rationally consulting their own self-interest, will ultimately deplete a shared limited resource, even when it is clear that it is not in anyone's long-term interest for this...
where it is most efficient for everyone to pollute and for no one to clean-up, and everyone is worse as a result (Hardin, 1968). Thus, even in a country like the US with a high level of income, carbon emissions are not decreasing in accordance with the EKC.
Arik Levinson points out that researchers disagree about the shape of the curve when longer-term time scales are evaluated. For example, Millimet and Stengos regard the traditional "inverse U" shape as actually being an "N" shape, indicating that pollution increases as a country develops, decreases once the threshold GDP is reached, and then begins increasing as national income continues to increase. While such findings are still being debated, it could prove to be important because it poses the concerning question of whether pollution actually begins to decline for good when an economic threshold is reached or whether the decrease is only in local pollutants and pollution is simply exported to poorer developing countries. Levinson concludes that the environmental Kuznets curve is insufficient to support a pollution policy regardless whether it is laissez-faire
Laissez-faire
In economics, laissez-faire describes an environment in which transactions between private parties are free from state intervention, including restrictive regulations, taxes, tariffs and enforced monopolies....
or interventionist, although the literature has been used this way by the press.
Arrow et al. argue pollution-income progression of agrarian communities (clean) to industrial economies (pollution intensive) to service economies (cleaner) would appear to be false if pollution increases again at the end due to higher levels of income and consumption of the population at large. A difficulty with this model is that it lacks predictive power because it is highly uncertain how the next phase of economic development will be characterized.
Suri & Chapman argue that a net pollution reduction may not actually be occurring on global scales. Wealthy nations have a trend of exporting the activities that create the most pollution, like manufacturing of clothing and furniture, to poorer nations that are still in the process of industrial development (Suri and Chapman, 1998). This could mean that as the world's poor nations develop, they will have no place to export their pollution. Thus, this progression of environmental cleanup occurring in conjunction with economic growth cannot be replicated indefinitely because there may be nowhere to export waste and pollution intensive processes. However, Gene Grossman
Gene Grossman
Gene Michael Grossman is currently the Jacob Viner Professor of International Economics at Princeton University. He received his B.A. in Economics from Yale University in 1976 and his Ph.D. in Economics from the Massachusetts Institute of Technology in 1980...
and Alan B. Krueger
Alan B. Krueger
Alan Bennett Krueger is an American economist, Bendheim Professor of Economics and Public Affairs at Princeton University and Research Associate at the National Bureau of Economic Research. On March 7, 2009, he was nominated by President Barack Obama to be United States Assistant Secretary of the...
, the authors who initially made the correlation between economic growth, environmental clean-up, and the Kuznets curve, conclude that there is "no evidence that environmental quality deteriorates steadily with economic growth." And Yandle et al. conclude that "policies that stimulate growth (trade liberalization, economic restructuring, and price reform) should be good for the environment".
Stern warns "it is very easy to do bad econometrics", and says "the history of the EKC exemplifies what can go wrong". He finds that "Little or no attention has been paid to the statistical properties of the data used such as serial dependence or stochastic trends in time series and few tests of model adequacy have been carried out or presented. However, one of the main purposes of doing econometrics is to test which apparent relationships...are valid and which are spurious correlations". He states his unequivocal finding: "When we do take such statistics into account and use appropriate techniques we find that the EKC does not exist (Perman and Stern 2003). Instead, we get a more realistic view of the effect of economic growth and technological changes on environmental quality. It seems that most indicators of environmental degradation are monotonically rising in income though the 'income elasticity' is less than one and is not a simple function of income alone. Time related effects reduce environmental impacts in countries at all levels of income. However, in rapidly growing middle income countries the scale effect, which increases pollution and other degradation, overwhelms the time effect. In wealthy countries, growth is slower, and pollution reduction efforts can overcome the scale effect. This is the origin of the apparent EKC effect".
Sources and bibliography
- Shafik, N., “Economic Development and Environmental Quality: An Econometric Analysis”, Oxford Economic Papers, New Series, Vol. 46, Special Issue on Environmental Economics (Oct., 1994), pp. 757–773.
- Deacon, R.T. and C .S. Norman "Does the Environmental Kuznets Curve Describe How Individual Countries Behave?". Land Economics. vol.82. 2 (2006). pp. 291 – 315.
- Brenner, Y.S., Hartmut Kaelble, and Mark Thomas (1991): Income Distribution in Historical Perspective. Cambridge University Press.
- Van Zanden, J.L. (1995). Tracing the Beginning of the Kuznets Curve: Western Europe during the Early Modern Period. The Economic History Review, 48(4), 643-664.
- Tisdell, C.Clem TisdellClement Allan Tisdell is an Australian economist and Emeritus Professor at the University of Queensland...
(2001). Globalisation and sustainability: environmental Kuznets curve and the WTO. Ecological Economics, 39(2), 185-196. - Dasgupta, S., Laplante, B., Wang, H. and Wheeler, D. (2002). Confronting the Environmental Kuznets Curve. The Journal of Economic Perspectives, 16(1), 147-168.
- Harbaugh, B., Levinson, A. and Wilson, D. (2002). Reexamining the Empirical Evidence for an Environmental Kuznets Curve. Review of Economics and Statistics, 84(3).
- Munir Khasru Syed, Muaz Jalil Mohammad (2004), Revisiting Kuznets Hypothesis: An Analysis with Time Series and Panel Data,Bangladesh Development Studies, Vol 30 No 3-4, pg 89-112
- Munir Khasru Syed, Muaz Jalil Mohammad (2004), Revisiting Kuznets Hypothesis: An Analysis with Time Series and Panel Data (Draft) http://papers.ssrn.com/sol3/papers.cfm?abstract_id=1240658