
Heritability
Encyclopedia
The Heritability of a population is the proportion of observable differences between individuals that is due to genetic differences. Factors including genetics
, environment
and random chance can all contribute to the variation between individuals in their observable characteristics (in their "phenotype
s"). Heritability thus analyzes the relative contributions of differences in genetic and non-genetic factors to the total phenotypic variance
in a population. For instance, some humans in a population are taller than others; heritability attempts to identify how much genetics are playing a role in part of the population being extra tall.
Heritability is measured by estimating the relative contributions of genetic and non-genetic differences to the total phenotypic variation in a population. Heritability is an important concept in quantitative genetics
, particularly in selective breeding
and behaviour genetics (for instance twin studies
), but is less widely used in population genetics
.
Heritability measures the fraction of phenotype variability that can be attributed to genetic variation. This is not the same as saying that this fraction of an individual phenotype is caused by genetics. In addition, heritability can change without any genetic change occurring (e.g. when the environment starts contributing to more variation). A case in point, consider that both genes and environment have the potential to influence intelligence. Heritability could increase if genetic variation increases, causing individuals to showing more phenotypic variation (e.g. to show different levels of intelligence). On the other hand, heritability might also increase if the environmental variation decreases, causing individuals to show less phenotypic variation (e.g. to show more similar levels of intelligence). Heritability is increasing because genetics are contributing more variation, or because non-genetic factors are contributing less variation; what matters is the relative contribution. Here we see why heritability is specific to a particular population in a particular environment.
The extent of dependence of phenotype on environment can also be function of the genes involved. Matters of heritability are complicated because genes may canalize a phenotype, making its expression almost inevitable in all occurring environments. Individuals with the same genotype can also exhibit different phenotypes through a mechanism called phenotypic plasticity
, which makes heritability difficult to measure in some cases. Recent insights in molecular biology have identified changes in transcriptional
activity of individual genes associated with environmental changes. However, there are a large number of genes whose transcription is not affected by the environment.
 Estimates of heritability use statistical analyses to help to identify the causes of differences between individuals. Because heritability is concerned with variance, it is necessarily an account of the differences between individuals in a population. Heritability can be univariate – examining a single trait – or multivariate – examining the genetic and environmental associations between multiple traits at once. This allows a test of the genetic overlap between different phenotypes: for instance hair colour and eye colour. Environment and genetics may also interact, and heritability analyses can test for and examine these interactions (GxE models).
A prerequisite for heritability analyses is that there is some population variation to account for. In practice, all traits vary and almost all traits show some heritability.
For example, in a population with no diversity in hair colour, "heritability" of hair colour would be undefined. In populations with varying values of a trait (e.g. see the image on the left), variance could be due to environment (hair dye for instance) or genetic differences, and heritability could vary from 0-100%.
This last point highlights the fact that heritability cannot take into account the effect of factors which are invariant in the population. Factors may be invariant if they are absent and don't exist in the population (e.g. no one has access to a particular antibiotic), or because they are omni-present (e.g. if everyone is drinking coffee).
as the sum of genetic and environmental effects:
Likewise the variance in the trait – Var (P) – is the sum of genetic effects as follows:
In a planned experiment Cov(G,E) can be controlled and held at 0. In this case, heritability is defined as: .
.
H2 is the broad-sense heritability. This reflects all the genetic contributions to a population's phenotypic variance including additive, dominant
, and epistatic
(multi-genic interactions), as well as maternal and paternal effects
, where individuals are directly affected by their parents' phenotype (such as with milk production in mammals).
These additional terms can be decomposed in some genetic models. 'An important example is capturing only portion of the variance due to additive (allelic) genetic effects. This additive genetic portion is known as Narrow-sense heritability and is defined as
An upper case H2 is used to denote broad sense, and lower case h2 for narrow sense.
Additive variance is important for selection
. If a selective pressure such as improving livestock is exerted, the response of the trait is directly related to narrow-sense heritability. The mean of the trait will increase in the next generation as a function of how much the mean of the selected parents differs from the mean of the population from which the selected parents were chosen. The observed response to selection leads to an estimate of the narrow-sense heritability (called realized heritability). This is the principle underlying artificial selection
or breeding.
 The simplest genetic model involves a single locus with two alleles (b and B) affecting one quantitative phenotype.
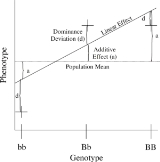
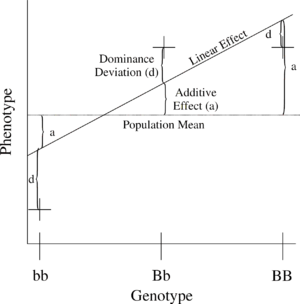
The number of B alleles can vary from 0, 1, or 2. For any genotype, BiBj, the expected phenotype can then be written as the sum of the overall mean, a linear effect, and a dominance deviation: = Population mean
+ Additive Effect ( ) + Dominance Deviation (
 ).
).
The additive genetic variance at this locus is the weighted average
of the squares of the additive effects:
where
There is a similar relationship for variance of dominance deviations:
where
The linear regression
of phenotype on genotype is shown in Figure 1.
analyses required to estimate the genetic
and environmental
components of variance depend on the sample characteristics. Briefly, better estimates are obtained using data from individuals with widely varying levels of genetic relationship - such as twins
, siblings, parents and offspring, rather than from more distantly related (and therefore similar) subjects. The standard error
for heritability estimates is improved with large sample sizes.
In non-human populations it is often possible to collect information in a controlled way. For example, among farm animals it is easy to arrange for a bull to produce offspring from a large number of cows and to control environments. Such experimental control is impossible when gathering human data, relying on naturally occurring relationships and environments.
Studies of human heritability often utilise adoption study designs, often with identical twins
who have been separated early in life and raised in different environments (see for example Fig. 2). Such individuals have identical genotypes and can be used to separate the effects of genotype and environment. A limit of this design is the common prenatal environment and the relatively low numbers of twins reared apart. A second and more common design is the twin study
in which the similarity of identical and fraternal twins is used to estimate heritability. entail problems of their own, such as: identical twins are not completely genetically identical. Studies of twins also examine differences between twins and non-twin siblings, for instance to examine phenomena such as intrauterine competition (for example, twin-to-twin transfusion syndrome
).
Heritability estimates are always relative to the genetic and environmental factors in the population, and are not absolute measurements of the contribution of genetic and environmental factors to a phenotype. Heritability estimates reflect the amount of variation in genotypic effects compared to variation in environmental effects.
Heritability can be made larger by diversifying the genetic background, e.g., by using only very outbred individuals (which increases VarG) and/or by minimizing environmental effects (decreasing VarE). The converse also holds. Due to such effects, different populations of a species might have different heritabilities for the same trait.
In observational studies
, or because of evokative effects (where a genome evokes environments by its effect on them), G and E may covary: gene environment correlation. Depending on the methods used to estimate heritability, correlations between genetic factors and shared or non-shared environments may or may not be confounded with heritability.
Heritability estimates are often misinterpreted if it is not understood that they refer to the proportion of variation between individuals in a population that is influenced by genetic factors. Heritability describes the population, not individuals within that population. For example, It is incorrect to say that since the heritability of a personality trait is about .6, that means that 60% of your personality is inherited from your parents and 40% comes from the environment.
A highly heritable trait (such as eye color
) assumes environmental inputs which (though they are invariant in most populations) are required for development: for instance temperatures and atmospheres supporting life, etc.). A more useful distinction than "nature vs. nurture" is "obligate vs. facultative" -- under typical environmental ranges, what traits are more "obligate" (e.g., the nose—everyone has a nose) or more "facultative" (sensitive to environmental variations, such as specific language learned during infancy). Another useful distinction is between traits that are likely to be adaptations (such as the nose) vs. those that are byproducts of adaptations (such the white color of bones), or are due to random variation (non-adaptive variation in, say, nose shape or size).
One school of thought
was developed by Sewall Wright
at The University of Chicago
, and further popularized by C. C. Li (University of Chicago
) and J. L. Lush (Iowa State University
). It is based on the analysis of correlations and, by extension, regression. Path Analysis was developed by Sewall Wright
as a way of estimating heritability.
The second was originally developed by R. A. Fisher
and expanded at The University of Edinburgh
, Iowa State University
, and North Carolina State University
, as well as other schools. It is based on the analysis of variance
of breeding studies, using the intraclass correlation of relatives. Various methods of estimating components of variance (and, hence, heritability) from ANOVA
are used in these analyses.
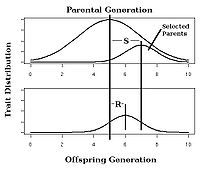 Calculating the strength of selection, S (the difference in mean trait between the population as a whole and the selected parents of the next generation, also called the selection differential) and response to selection R (the difference in offspring and whole parental generation mean trait) in an artificial selection experiment will allow calculation of realized heritability as the response to selection relative to the strength of selection, h2=R/S as in Fig. 3.
 where r can be thought of as the coefficient of relatedness
, b is the coefficient of regression and t the coefficient of correlation.
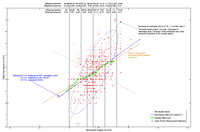 Heritability may be estimated by comparing parent and offspring traits (as in Fig. 4). The slope of the line (0.57) approximates the heritability of the trait when offspring values are regressed against the average trait in the parents. If only one parent's value is used then heritability is twice the slope. (note that this is the source of the term "regression
", since the offspring values always tend to regress to the mean
value for the population, i.e., the slope is always less than one). This regression effect also underlies the DeFries Fulker
method for analysing twins selected for one member being affected.
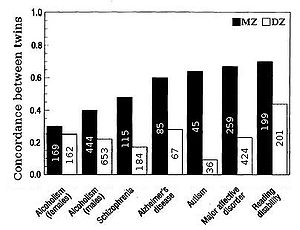 Heritability for traits in humans is most frequently estimated by comparing resemblances between twins (Fig. 2 & 5). Fraternal (DZ) twins on average share half their genes (see Assortative mating
) and so identical (MZ) twins on average are twice as genetically similar as DZ twins. A crude estimate of heritability, then, is approximately twice the difference in correlation
between MZ and DZ twins, i.e. Falconer's formula
H2=2(r(MZ)-r(DZ)).
The effect of shared environment, c2, contributes to similarity between siblings due to the commonality of the environment they are raised in. Shared environment is approximated by the DZ correlation minus half heritability, which is the degree to which DZ twins share the same genes, c2=DZ-1/2h2. Unique environmental variance, e2, reflects the degree to which identical twins raised together are dissimilar, e2=1-r(MZ).
The methodology of the classical twin study
has been criticized, but some of these criticisms do not take into account the methodological innovations and refinements described above.
and heritability estimated . This design is especially powerful for untangling confounds such as reverse causality, maternal effects such as the prenatal environment, and confounding of genetic dominance, shared environment, and maternal gene effects

where
 is the effect of genotype Gi
and is the environmental effect.
Consider an experiment with a group of sires and their progeny from random dams. Since the progeny get half of their genes from the father and half from their (random) mother, the progeny equation is

The second group of progeny are comparisons of means of half sibs with each other (called among sire group). In addition to the error term
as in the within sire groups, we have an addition term due to the differences among different means of half sibs. The intraclass correlation is ,
,
since environmental effects are independent of each other.
 sires and
  progeny per sire, we can calculate the following ANOVA, using
  as the genetic variance and
  as the environmental variance:
The term is the intraclass correlation
among half sibs. We can easily calculate . The Expected Mean Square is calculated from the relationship of the individuals (progeny within a sire are all half-sibs, for example), and an understanding of intraclass correlations.

where
 is the additive effect of the ith allele,
  is the additive effect of the jth allele,
  is the dominance deviation for the ijth genotype, and
  is the environment.
Experiments can be run with a similar setup to the one given in Table 1. Using different relationship groups, we can evaluate different intraclass correlations. Using as the additive genetic variance and
  as the dominance deviation variance, intraclass correlations become linear function
s of these parameters. In general,
where and
and  are found as
 P[ alleles drawn at random from the relationship pair are identical by descent
], and
 P[ genotypes drawn at random from the relationship pair are identical by descent
].
Some common relationships and their coefficients are given in Table 2.
(REML) model. The raw data
will usually have three or more datapoints for each individual: a code for the sire, a code for the dam and one or several trait values. Different trait values may be for different traits or for different timepoints of measurement.
The currently popular methodology relies on high degrees of certainty over the identities of the sire and dam; it is not common to treat the sire identity probabilistically. This is not usually a problem, since the methodology is rarely applied to wild populations (although it has been used for several wild ungulate and bird populations), and sires are invariably known with a very high degree of certainty in breeding programmes. There are also algorithms that account for uncertain paternity.
The pedigrees can be viewed using programs such as Pedigree Viewer http://www-personal.une.edu.au/~bkinghor/pedigree.htm, and analysed with programs such as ASReml
, VCE http://vce.tzv.fal.de/index.pl, WOMBAT http://agbu.une.edu.au/~kmeyer/wombat.html or BLUPF90 family's programs http://nce.ads.uga.edu/~ignacy/programs.html
of plants and animals, the expected response to selection can be estimated by the following equation:
R = h2S
In this equation, the Response to Selection (R) is defined as the realized average difference between the parent generation and the next generation. The Selection Differential (S) is defined as the average difference between the parent generation and the selected parents.
For example, imagine that a plant breeder is involved in a selective breeding project with the aim of increasing the number of kernels per ear of corn. For the sake of argument, let us assume that the average ear of corn in the parent generation has 100 kernels. Let us also assume that the selected parents produce corn with an average of 120 kernels per ear. If h2 equals 0.5, then the next generation will produce corn with an average of 0.5(120-100) = 10 additional kernels per ear. Therefore, the total number of kernels per ear of corn will equal, on average, 110.
and Jay Joseph have dismissed heritability estimates as useless. A 2008 paper in Nature Reviews Genetics
stated however: "Despite continuous misunderstandings and controversies over its use and application, heritability remains key to the response to selection in evolutionary biology and agriculture, and to the prediction of disease risk in medicine. Recent reports of substantial heritability for gene expression and new estimation methods using marker data highlight the relevance of heritability in the genomics era."
Genetics
Genetics , a discipline of biology, is the science of genes, heredity, and variation in living organisms....
, environment
Environmental factor
Environmental factor or ecological factor or ecofactor is any factor, abiotic or biotic, that influences living organisms.- Environmental factors inducing diseases :...
and random chance can all contribute to the variation between individuals in their observable characteristics (in their "phenotype
Phenotype
A phenotype is an organism's observable characteristics or traits: such as its morphology, development, biochemical or physiological properties, behavior, and products of behavior...
s"). Heritability thus analyzes the relative contributions of differences in genetic and non-genetic factors to the total phenotypic variance
Variance
In probability theory and statistics, the variance is a measure of how far a set of numbers is spread out. It is one of several descriptors of a probability distribution, describing how far the numbers lie from the mean . In particular, the variance is one of the moments of a distribution...
in a population. For instance, some humans in a population are taller than others; heritability attempts to identify how much genetics are playing a role in part of the population being extra tall.
Heritability is measured by estimating the relative contributions of genetic and non-genetic differences to the total phenotypic variation in a population. Heritability is an important concept in quantitative genetics
Quantitative genetics
Quantitative genetics is the study of continuous traits and their underlying mechanisms. It is effectively an extension of simple Mendelian inheritance in that the combined effects of one or more genes and the environments in which they are expressed give rise to continuous distributions of...
, particularly in selective breeding
Selective breeding
Selective breeding is the process of breeding plants and animals for particular genetic traits. Typically, strains that are selectively bred are domesticated, and the breeding is sometimes done by a professional breeder. Bred animals are known as breeds, while bred plants are known as varieties,...
and behaviour genetics (for instance twin studies
Twin study
Twin studies help disentangle the relative importance of environmental and genetic influences on individual traits and behaviors. Twin research is considered a key tool in behavioral genetics and related fields...
), but is less widely used in population genetics
Population genetics
Population genetics is the study of allele frequency distribution and change under the influence of the four main evolutionary processes: natural selection, genetic drift, mutation and gene flow. It also takes into account the factors of recombination, population subdivision and population...
.
Heritability measures the fraction of phenotype variability that can be attributed to genetic variation. This is not the same as saying that this fraction of an individual phenotype is caused by genetics. In addition, heritability can change without any genetic change occurring (e.g. when the environment starts contributing to more variation). A case in point, consider that both genes and environment have the potential to influence intelligence. Heritability could increase if genetic variation increases, causing individuals to showing more phenotypic variation (e.g. to show different levels of intelligence). On the other hand, heritability might also increase if the environmental variation decreases, causing individuals to show less phenotypic variation (e.g. to show more similar levels of intelligence). Heritability is increasing because genetics are contributing more variation, or because non-genetic factors are contributing less variation; what matters is the relative contribution. Here we see why heritability is specific to a particular population in a particular environment.
The extent of dependence of phenotype on environment can also be function of the genes involved. Matters of heritability are complicated because genes may canalize a phenotype, making its expression almost inevitable in all occurring environments. Individuals with the same genotype can also exhibit different phenotypes through a mechanism called phenotypic plasticity
Phenotypic plasticity
Phenotypic plasticity is the ability of an organism to change its phenotype in response to changes in the environment. Such plasticity in some cases expresses as several highly morphologically distinct results; in other cases, a continuous norm of reaction describes the functional interrelationship...
, which makes heritability difficult to measure in some cases. Recent insights in molecular biology have identified changes in transcriptional
Transcription (genetics)
Transcription is the process of creating a complementary RNA copy of a sequence of DNA. Both RNA and DNA are nucleic acids, which use base pairs of nucleotides as a complementary language that can be converted back and forth from DNA to RNA by the action of the correct enzymes...
activity of individual genes associated with environmental changes. However, there are a large number of genes whose transcription is not affected by the environment.
Overview
A prerequisite for heritability analyses is that there is some population variation to account for. In practice, all traits vary and almost all traits show some heritability.
For example, in a population with no diversity in hair colour, "heritability" of hair colour would be undefined. In populations with varying values of a trait (e.g. see the image on the left), variance could be due to environment (hair dye for instance) or genetic differences, and heritability could vary from 0-100%.
This last point highlights the fact that heritability cannot take into account the effect of factors which are invariant in the population. Factors may be invariant if they are absent and don't exist in the population (e.g. no one has access to a particular antibiotic), or because they are omni-present (e.g. if everyone is drinking coffee).
Definition
Any particular phenotype can be modelledStatistical model
A statistical model is a formalization of relationships between variables in the form of mathematical equations. A statistical model describes how one or more random variables are related to one or more random variables. The model is statistical as the variables are not deterministically but...
as the sum of genetic and environmental effects:
- Phenotype (P) = Genotype (G) + Environment (E).
Likewise the variance in the trait – Var (P) – is the sum of genetic effects as follows:
- Var(P) = Var(G) + Var(E) + 2 Cov(G,E).
In a planned experiment Cov(G,E) can be controlled and held at 0. In this case, heritability is defined as:
.H2 is the broad-sense heritability. This reflects all the genetic contributions to a population's phenotypic variance including additive, dominant
Dominance relationship
Dominance in genetics is a relationship between two variant forms of a single gene, in which one allele masks the effect of the other in influencing some trait. In the simplest case, if a gene exists in two allelic forms , three combinations of alleles are possible: AA, AB, and BB...
, and epistatic
Epistasis
In genetics, epistasis is the phenomenon where the effects of one gene are modified by one or several other genes, which are sometimes called modifier genes. The gene whose phenotype is expressed is called epistatic, while the phenotype altered or suppressed is called hypostatic...
(multi-genic interactions), as well as maternal and paternal effects
Maternal effect
A maternal effect is a situation where the phenotype of an organism is determined not only by the environment it experiences and its genotype, but also by the environment and phenotype of its mother...
, where individuals are directly affected by their parents' phenotype (such as with milk production in mammals).
These additional terms can be decomposed in some genetic models. 'An important example is capturing only portion of the variance due to additive (allelic) genetic effects. This additive genetic portion is known as Narrow-sense heritability and is defined as
An upper case H2 is used to denote broad sense, and lower case h2 for narrow sense.
Additive variance is important for selection
Natural selection
Natural selection is the nonrandom process by which biologic traits become either more or less common in a population as a function of differential reproduction of their bearers. It is a key mechanism of evolution....
. If a selective pressure such as improving livestock is exerted, the response of the trait is directly related to narrow-sense heritability. The mean of the trait will increase in the next generation as a function of how much the mean of the selected parents differs from the mean of the population from which the selected parents were chosen. The observed response to selection leads to an estimate of the narrow-sense heritability (called realized heritability). This is the principle underlying artificial selection
Artificial selection
Artificial selection describes intentional breeding for certain traits, or combination of traits. The term was utilized by Charles Darwin in contrast to natural selection, in which the differential reproduction of organisms with certain traits is attributed to improved survival or reproductive...
or breeding.
Example
The number of B alleles can vary from 0, 1, or 2. For any genotype, BiBj, the expected phenotype can then be written as the sum of the overall mean, a linear effect, and a dominance deviation:
= Population meanMean
In statistics, mean has two related meanings:* the arithmetic mean .* the expected value of a random variable, which is also called the population mean....
+ Additive Effect (
) + Dominance Deviation ().The additive genetic variance at this locus is the weighted average
Weighted mean
The weighted mean is similar to an arithmetic mean , where instead of each of the data points contributing equally to the final average, some data points contribute more than others...
of the squares of the additive effects:
where
There is a similar relationship for variance of dominance deviations:
where
The linear regression
Linear regression
In statistics, linear regression is an approach to modeling the relationship between a scalar variable y and one or more explanatory variables denoted X. The case of one explanatory variable is called simple regression...
of phenotype on genotype is shown in Figure 1.
Estimating heritability
Since only P can be observed or measured directly, heritability must be estimated from the similarities observed in subjects varying in their level of genetic or environmental similarity. The statisticalStatistics
Statistics is the study of the collection, organization, analysis, and interpretation of data. It deals with all aspects of this, including the planning of data collection in terms of the design of surveys and experiments....
analyses required to estimate the genetic
Genetics
Genetics , a discipline of biology, is the science of genes, heredity, and variation in living organisms....
and environmental
Environment (biophysical)
The biophysical environment is the combined modeling of the physical environment and the biological life forms within the environment, and includes all variables, parameters as well as conditions and modes inside the Earth's biosphere. The biophysical environment can be divided into two categories:...
components of variance depend on the sample characteristics. Briefly, better estimates are obtained using data from individuals with widely varying levels of genetic relationship - such as twins
TWINS
Two Wide-Angle Imaging Neutral-Atom Spectrometers are a pair of NASA instruments aboard two United States National Reconnaissance Office satellites in Molniya orbits. TWINS was designed to provide stereo images of the Earth's ring current. The first instrument, TWINS-1, was launched aboard USA-184...
, siblings, parents and offspring, rather than from more distantly related (and therefore similar) subjects. The standard error
Standard error (statistics)
The standard error is the standard deviation of the sampling distribution of a statistic. The term may also be used to refer to an estimate of that standard deviation, derived from a particular sample used to compute the estimate....
for heritability estimates is improved with large sample sizes.
In non-human populations it is often possible to collect information in a controlled way. For example, among farm animals it is easy to arrange for a bull to produce offspring from a large number of cows and to control environments. Such experimental control is impossible when gathering human data, relying on naturally occurring relationships and environments.
Studies of human heritability often utilise adoption study designs, often with identical twins
Twin
A twin is one of two offspring produced in the same pregnancy. Twins can either be monozygotic , meaning that they develop from one zygote that splits and forms two embryos, or dizygotic because they develop from two separate eggs that are fertilized by two separate sperm.In contrast, a fetus...
who have been separated early in life and raised in different environments (see for example Fig. 2). Such individuals have identical genotypes and can be used to separate the effects of genotype and environment. A limit of this design is the common prenatal environment and the relatively low numbers of twins reared apart. A second and more common design is the twin study
Twin study
Twin studies help disentangle the relative importance of environmental and genetic influences on individual traits and behaviors. Twin research is considered a key tool in behavioral genetics and related fields...
in which the similarity of identical and fraternal twins is used to estimate heritability. entail problems of their own, such as: identical twins are not completely genetically identical. Studies of twins also examine differences between twins and non-twin siblings, for instance to examine phenomena such as intrauterine competition (for example, twin-to-twin transfusion syndrome
Twin-to-twin transfusion syndrome
Twin-to-twin transfusion syndrome is a complication of disproportionate blood supply, resulting in high morbidity and mortality. It can affect monochorionic multiples, that is multiple pregnancies where two or more fetuses share a chorion and hence a single placenta...
).
Heritability estimates are always relative to the genetic and environmental factors in the population, and are not absolute measurements of the contribution of genetic and environmental factors to a phenotype. Heritability estimates reflect the amount of variation in genotypic effects compared to variation in environmental effects.
Heritability can be made larger by diversifying the genetic background, e.g., by using only very outbred individuals (which increases VarG) and/or by minimizing environmental effects (decreasing VarE). The converse also holds. Due to such effects, different populations of a species might have different heritabilities for the same trait.
In observational studies
Observational study
In epidemiology and statistics, an observational study draws inferences about the possible effect of a treatment on subjects, where the assignment of subjects into a treated group versus a control group is outside the control of the investigator...
, or because of evokative effects (where a genome evokes environments by its effect on them), G and E may covary: gene environment correlation. Depending on the methods used to estimate heritability, correlations between genetic factors and shared or non-shared environments may or may not be confounded with heritability.
Heritability estimates are often misinterpreted if it is not understood that they refer to the proportion of variation between individuals in a population that is influenced by genetic factors. Heritability describes the population, not individuals within that population. For example, It is incorrect to say that since the heritability of a personality trait is about .6, that means that 60% of your personality is inherited from your parents and 40% comes from the environment.
A highly heritable trait (such as eye color
Eye color
Eye color is a polygenic phenotypic character and is determined by two distinct factors: the pigmentation of the eye's iris and the frequency-dependence of the scattering of light by the turbid medium in the stroma of the iris....
) assumes environmental inputs which (though they are invariant in most populations) are required for development: for instance temperatures and atmospheres supporting life, etc.). A more useful distinction than "nature vs. nurture" is "obligate vs. facultative" -- under typical environmental ranges, what traits are more "obligate" (e.g., the nose—everyone has a nose) or more "facultative" (sensitive to environmental variations, such as specific language learned during infancy). Another useful distinction is between traits that are likely to be adaptations (such as the nose) vs. those that are byproducts of adaptations (such the white color of bones), or are due to random variation (non-adaptive variation in, say, nose shape or size).
Estimation methods
There are essentially two schools of thought regarding estimation of heritability.One school of thought
School (discipline)
A school of thought is a collection or group of people who share common characteristics of opinion or outlook of a philosophy, discipline, belief, social movement, cultural movement, or art movement....
was developed by Sewall Wright
Sewall Wright
Sewall Green Wright was an American geneticist known for his influential work on evolutionary theory and also for his work on path analysis. With R. A. Fisher and J.B.S. Haldane, he was a founder of theoretical population genetics. He is the discoverer of the inbreeding coefficient and of...
at The University of Chicago
University of Chicago
The University of Chicago is a private research university in Chicago, Illinois, USA. It was founded by the American Baptist Education Society with a donation from oil magnate and philanthropist John D. Rockefeller and incorporated in 1890...
, and further popularized by C. C. Li (University of Chicago
University of Chicago
The University of Chicago is a private research university in Chicago, Illinois, USA. It was founded by the American Baptist Education Society with a donation from oil magnate and philanthropist John D. Rockefeller and incorporated in 1890...
) and J. L. Lush (Iowa State University
Iowa State University
Iowa State University of Science and Technology, more commonly known as Iowa State University , is a public land-grant and space-grant research university located in Ames, Iowa, United States. Iowa State has produced astronauts, scientists, and Nobel and Pulitzer Prize winners, along with a host of...
). It is based on the analysis of correlations and, by extension, regression. Path Analysis was developed by Sewall Wright
Sewall Wright
Sewall Green Wright was an American geneticist known for his influential work on evolutionary theory and also for his work on path analysis. With R. A. Fisher and J.B.S. Haldane, he was a founder of theoretical population genetics. He is the discoverer of the inbreeding coefficient and of...
as a way of estimating heritability.
The second was originally developed by R. A. Fisher
Ronald Fisher
Sir Ronald Aylmer Fisher FRS was an English statistician, evolutionary biologist, eugenicist and geneticist. Among other things, Fisher is well known for his contributions to statistics by creating Fisher's exact test and Fisher's equation...
and expanded at The University of Edinburgh
University of Edinburgh
The University of Edinburgh, founded in 1583, is a public research university located in Edinburgh, the capital of Scotland, and a UNESCO World Heritage Site. The university is deeply embedded in the fabric of the city, with many of the buildings in the historic Old Town belonging to the university...
, Iowa State University
Iowa State University
Iowa State University of Science and Technology, more commonly known as Iowa State University , is a public land-grant and space-grant research university located in Ames, Iowa, United States. Iowa State has produced astronauts, scientists, and Nobel and Pulitzer Prize winners, along with a host of...
, and North Carolina State University
North Carolina State University
North Carolina State University at Raleigh is a public, coeducational, extensive research university located in Raleigh, North Carolina, United States. Commonly known as NC State, the university is part of the University of North Carolina system and is a land, sea, and space grant institution...
, as well as other schools. It is based on the analysis of variance
Analysis of variance
In statistics, analysis of variance is a collection of statistical models, and their associated procedures, in which the observed variance in a particular variable is partitioned into components attributable to different sources of variation...
of breeding studies, using the intraclass correlation of relatives. Various methods of estimating components of variance (and, hence, heritability) from ANOVA
Analysis of variance
In statistics, analysis of variance is a collection of statistical models, and their associated procedures, in which the observed variance in a particular variable is partitioned into components attributable to different sources of variation...
are used in these analyses.
Regression/correlation methods of estimation
The first school of estimation uses regression and correlation to estimate heritability.Selection experiments
Comparison of close relatives
In the comparison of relatives, we find that in general, where r can be thought of as the coefficient of relatednessCoefficient of relationship
In population genetics, Sewall Wright's coefficient of relationship or coefficient of relatedness or relatedness or r is defined as 2 times the Coefficient of Inbreeding...
, b is the coefficient of regression and t the coefficient of correlation.
Parent-offspring regression
Regression analysis
In statistics, regression analysis includes many techniques for modeling and analyzing several variables, when the focus is on the relationship between a dependent variable and one or more independent variables...
", since the offspring values always tend to regress to the mean
Regression toward the mean
In statistics, regression toward the mean is the phenomenon that if a variable is extreme on its first measurement, it will tend to be closer to the average on a second measurement, and—a fact that may superficially seem paradoxical—if it is extreme on a second measurement, will tend...
value for the population, i.e., the slope is always less than one). This regression effect also underlies the DeFries Fulker
David Fulker
David W. Fulker was a behavioural geneticist. Among positions of esteem, he was elected president of the Behavior Genetics Association , and was executive editor of the society's journal Behavior Genetics...
method for analysing twins selected for one member being affected.
Sibling comparison
A basic approach to heritability can be take using full-sib designs: comparing similarity between siblings who share both a biological mother and a father . When there is only additive gene action, this sibling phenotypic correlation is an index of familiarity – the sum of half the additive genetic variance plus full effect of the common environment . It thus places an upper-limit on additive heritability of twice the full-sib phenotypic correlation. Half-sib designs compare phenotypic traits of siblings that share one parent with other sibling groups.Twin studies
Assortative mating
Assortative mating , and the related concept Disassortative mating, is the phenomenon where a sexually reproducing organism chooses to mate with individuals that are similar or dissimilar to itself in some specific manner...
) and so identical (MZ) twins on average are twice as genetically similar as DZ twins. A crude estimate of heritability, then, is approximately twice the difference in correlation
Correlation
In statistics, dependence refers to any statistical relationship between two random variables or two sets of data. Correlation refers to any of a broad class of statistical relationships involving dependence....
between MZ and DZ twins, i.e. Falconer's formula
Falconer's formula
Falconer's formula is used in twin studies to determine the genetic heritability of a trait based on the difference between twin correlations.The formula is hb2 = 2, where hb2 is the broad sense heritability, rmz is the identical twin correlation, and rdz is the fraternal twin correlation...
H2=2(r(MZ)-r(DZ)).
The effect of shared environment, c2, contributes to similarity between siblings due to the commonality of the environment they are raised in. Shared environment is approximated by the DZ correlation minus half heritability, which is the degree to which DZ twins share the same genes, c2=DZ-1/2h2. Unique environmental variance, e2, reflects the degree to which identical twins raised together are dissimilar, e2=1-r(MZ).
The methodology of the classical twin study
Twin study
Twin studies help disentangle the relative importance of environmental and genetic influences on individual traits and behaviors. Twin research is considered a key tool in behavioral genetics and related fields...
has been criticized, but some of these criticisms do not take into account the methodological innovations and refinements described above.
Extended pedigree design
While often heritability is analysed in single generations: comparing MZ twins raised apart, or comparing the similarity of MZ and DZ twins, considerable power can be gained using more complex relationships. By studying a trait in multi-generational families, the multiple recombinations of genetic and environmental effects can be decomposed using software such as ASRemlASReml
ASReml is a statistical software package for fitting linear mixed models using restricted maximum likelihood, a technique commonly used in plant and animal breeding and quantitative genetics as well as other fields...
and heritability estimated . This design is especially powerful for untangling confounds such as reverse causality, maternal effects such as the prenatal environment, and confounding of genetic dominance, shared environment, and maternal gene effects
Analysis of variance methods of estimation
The second set of methods of estimation of heritability involves ANOVA and estimation of variance components.Basic model
We use the basic discussion of Kempthorne (1957 [1969]). Considering only the most basic of genetic models, we can look at the quantitative contribution of a single locus with genotype Gi aswhere
is the effect of genotype Giand
is the environmental effect.Consider an experiment with a group of sires and their progeny from random dams. Since the progeny get half of their genes from the father and half from their (random) mother, the progeny equation is
Intraclass correlations
Consider the experiment above. We have two groups of progeny we can compare. The first is comparing the various progeny for an individual sire (called within sire group). The variance will include terms for genetic variance (since they did not all get the same genotype) and environmental variance. This is thought of as an error term.The second group of progeny are comparisons of means of half sibs with each other (called among sire group). In addition to the error term
Errors and residuals in statistics
In statistics and optimization, statistical errors and residuals are two closely related and easily confused measures of the deviation of a sample from its "theoretical value"...
as in the within sire groups, we have an addition term due to the differences among different means of half sibs. The intraclass correlation is
,since environmental effects are independent of each other.
The ANOVA
In an experiment with sires and progeny per sire, we can calculate the following ANOVA, using as the genetic variance and as the environmental variance:| Source | d.f. | Mean Square | Expected Mean Square |
|---|---|---|---|
| Among sire groups |  |
 |
 |
| Within sire groups |  |
 |
 |
The
term is the intraclass correlationIntraclass correlation
In statistics, the intraclass correlation is a descriptive statistic that can be used when quantitative measurements are made on units that are organized into groups. It describes how strongly units in the same group resemble each other...
among half sibs. We can easily calculate
. The Expected Mean Square is calculated from the relationship of the individuals (progeny within a sire are all half-sibs, for example), and an understanding of intraclass correlations.Model with additive and dominance terms
For a model with additive and dominance terms, but not others, the equation for a single locus iswhere
is the additive effect of the ith allele, is the additive effect of the jth allele, is the dominance deviation for the ijth genotype, and is the environment.Experiments can be run with a similar setup to the one given in Table 1. Using different relationship groups, we can evaluate different intraclass correlations. Using
as the additive genetic variance and as the dominance deviation variance, intraclass correlations become linear functionLinear function
In mathematics, the term linear function can refer to either of two different but related concepts:* a first-degree polynomial function of one variable;* a map between two vector spaces that preserves vector addition and scalar multiplication....
s of these parameters. In general,
- Intraclass correlation

where
and are found asP[ alleles drawn at random from the relationship pair are identical by descentIdentity by descent
Two or more alleles are identical by descent if they are identical copies of the same ancestral allele. This property is often used in genetic linkage to identify alleles which are potential candidates for harboring mutations causing a genetic disease....
], and
P[ genotypes drawn at random from the relationship pair are identical by descentIdentity by descent
Two or more alleles are identical by descent if they are identical copies of the same ancestral allele. This property is often used in genetic linkage to identify alleles which are potential candidates for harboring mutations causing a genetic disease....
].
Some common relationships and their coefficients are given in Table 2.
| Relationship |  |
 |
|---|---|---|
| Identical Twins |  |
 |
| Parent-Offspring |  |
 |
| Half Siblings |  |
 |
| Full Siblings |  |
 |
| First Cousins |  |
 |
| Double First Cousins |  |
 |
Larger models
When a large, complex pedigree is available for estimating heritability, the most efficient use of the data is in a restricted maximum likelihoodRestricted maximum likelihood
In statistics, the restricted maximum likelihood approach is a particular form of maximum likelihood estimation which does not base estimates on a maximum likelihood fit of all the information, but instead uses a likelihood function calculated from a transformed set of data, so that nuisance...
(REML) model. The raw data
Raw data
'\putang inaIn computing, it may have the following attributes: possibly containing errors, not validated; in sfferent formats; uncoded or unformatted; and suspect, requiring confirmation or citation. For example, a data input sheet might contain dates as raw data in many forms: "31st January...
will usually have three or more datapoints for each individual: a code for the sire, a code for the dam and one or several trait values. Different trait values may be for different traits or for different timepoints of measurement.
The currently popular methodology relies on high degrees of certainty over the identities of the sire and dam; it is not common to treat the sire identity probabilistically. This is not usually a problem, since the methodology is rarely applied to wild populations (although it has been used for several wild ungulate and bird populations), and sires are invariably known with a very high degree of certainty in breeding programmes. There are also algorithms that account for uncertain paternity.
The pedigrees can be viewed using programs such as Pedigree Viewer http://www-personal.une.edu.au/~bkinghor/pedigree.htm, and analysed with programs such as ASReml
ASReml
ASReml is a statistical software package for fitting linear mixed models using restricted maximum likelihood, a technique commonly used in plant and animal breeding and quantitative genetics as well as other fields...
, VCE http://vce.tzv.fal.de/index.pl, WOMBAT http://agbu.une.edu.au/~kmeyer/wombat.html or BLUPF90 family's programs http://nce.ads.uga.edu/~ignacy/programs.html
Response to Selection
In selective breedingSelective breeding
Selective breeding is the process of breeding plants and animals for particular genetic traits. Typically, strains that are selectively bred are domesticated, and the breeding is sometimes done by a professional breeder. Bred animals are known as breeds, while bred plants are known as varieties,...
of plants and animals, the expected response to selection can be estimated by the following equation:
R = h2S
In this equation, the Response to Selection (R) is defined as the realized average difference between the parent generation and the next generation. The Selection Differential (S) is defined as the average difference between the parent generation and the selected parents.
For example, imagine that a plant breeder is involved in a selective breeding project with the aim of increasing the number of kernels per ear of corn. For the sake of argument, let us assume that the average ear of corn in the parent generation has 100 kernels. Let us also assume that the selected parents produce corn with an average of 120 kernels per ear. If h2 equals 0.5, then the next generation will produce corn with an average of 0.5(120-100) = 10 additional kernels per ear. Therefore, the total number of kernels per ear of corn will equal, on average, 110.
Controversies
Some authors like Steven RoseSteven Rose
Steven P. Rose is a Professor of Biology and Neurobiology at the Open University and University of London.-Life:...
and Jay Joseph have dismissed heritability estimates as useless. A 2008 paper in Nature Reviews Genetics
Nature Reviews Genetics
Nature Reviews Genetics is a monthly review journal in genetics and covers the full breadth of modern genetics. The journal publishes review and perspective articles written by experts in the field subject to peer review and copy editing to provide authoritative coverage of topics...
stated however: "Despite continuous misunderstandings and controversies over its use and application, heritability remains key to the response to selection in evolutionary biology and agriculture, and to the prediction of disease risk in medicine. Recent reports of substantial heritability for gene expression and new estimation methods using marker data highlight the relevance of heritability in the genomics era."
Books
- Kempthorne, O (1957 [1969]) An Introduction to Genetic Statistics. John Wiley. Reprinted, 1969 by Iowa State University Press.
Further reading
- Gillespie, G. H. (1997). Population Genetics: A Concise Guide. Johns Hopkins University Press.
- Lynch, M. & Walsh, B. 1997. Genetics and Analysis of Quantitative Traits. Sinauer Associates. ISBN 0-87893-481-2.